Fig. 28
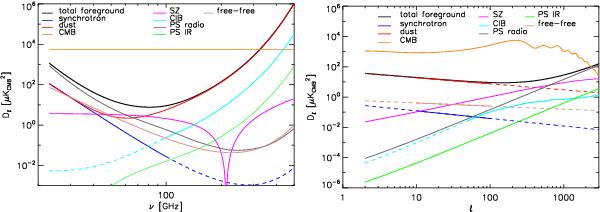
Left: frequency spectra of individual diffuse foregrounds at high galactic latitudes, estimated at ℓ = 200, the angular scale at which CMB fluctuations are greatest and foreground fluctuations are relatively the least important (see Fig. 27). The horizontal line gives the level of the CMB. Right: angular power spectra of various foregrounds at 100 GHz, along with the best-fit Planck CMB spectrum. In both panels, solid lines show where the spectra are estimated from data, and dashed lines are extrapolations.
Current usage metrics show cumulative count of Article Views (full-text article views including HTML views, PDF and ePub downloads, according to the available data) and Abstracts Views on Vision4Press platform.
Data correspond to usage on the plateform after 2015. The current usage metrics is available 48-96 hours after online publication and is updated daily on week days.
Initial download of the metrics may take a while.