Fig. 23
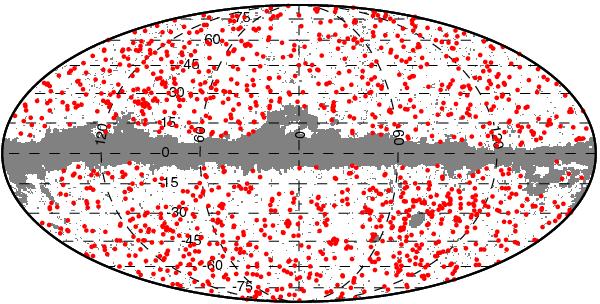
Sky distribution of the 1227 clusters and candidates (red dots), in a Mollweide projection with the Galactic plane horizontal and centred at zero longitude. The small grey dots show the positions of masked point sources, and the grey shading shows the mask used to exclude the Magellanic clouds and the Galactic plane. The mask covers 16.3% of the sky.
Current usage metrics show cumulative count of Article Views (full-text article views including HTML views, PDF and ePub downloads, according to the available data) and Abstracts Views on Vision4Press platform.
Data correspond to usage on the plateform after 2015. The current usage metrics is available 48-96 hours after online publication and is updated daily on week days.
Initial download of the metrics may take a while.