Fig. 20
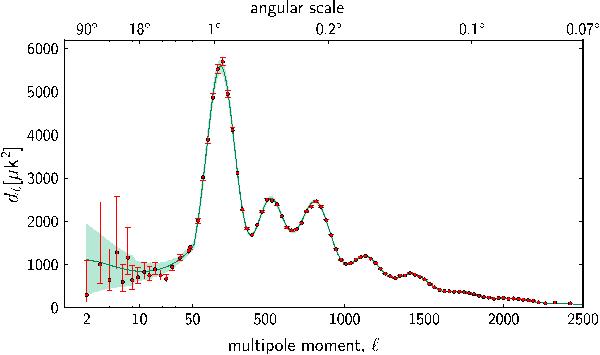
Temperature angular power spectrum of the primary CMB from Planck, showing a precise measurement of seven acoustic peaks that are well-fitted by a six-parameter ΛCDM model (the model plotted is the one labelled [Planck+WP+highL] in Planck Collaboration XVI 2014). The shaded area around the best-fit curve represents cosmic/sample variance, including the sky cut used. The error bars on individual points also include cosmic variance. The horizontal axis is logarithmic up to ℓ = 50, and linear beyond. The vertical scale is ℓ(ℓ + 1)Cl/ 2π. The measured spectrum shown here is exactly the same as the one shown in Fig. 1 of Planck Collaboration XVI (2014), but it has been rebinned to show better the low-ℓ region.
Current usage metrics show cumulative count of Article Views (full-text article views including HTML views, PDF and ePub downloads, according to the available data) and Abstracts Views on Vision4Press platform.
Data correspond to usage on the plateform after 2015. The current usage metrics is available 48-96 hours after online publication and is updated daily on week days.
Initial download of the metrics may take a while.