Fig. 13
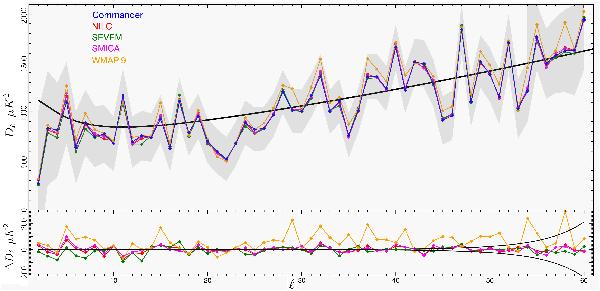
Top: temperature power spectra evaluated from downgraded Planck maps, estimated with Commander, NILC, SEVEM, and SMICA, and the 9-year WMAP ILC map, using the Bolpol quadratic estimator. The grey shaded area indicates the 1σ Fisher errors. The solid line is the PlanckΛCDM best fit model. Bottom: difference between the other power spectra in the top panel and Commander. The black lines show the expected 1σ uncertainty due to (regularization) noise. This is Fig. 34 of Planck Collaboration XV (2014).
Current usage metrics show cumulative count of Article Views (full-text article views including HTML views, PDF and ePub downloads, according to the available data) and Abstracts Views on Vision4Press platform.
Data correspond to usage on the plateform after 2015. The current usage metrics is available 48-96 hours after online publication and is updated daily on week days.
Initial download of the metrics may take a while.