| Issue |
A&A
Volume 570, October 2014
|
|
|---|---|---|
| Article Number | A45 | |
| Number of page(s) | 9 | |
| Section | Interstellar and circumstellar matter | |
| DOI | https://doi.org/10.1051/0004-6361/201424542 | |
| Published online | 15 October 2014 | |
New molecules in IRC +10216: confirmation of C5S and tentative identification of MgCCH, NCCP, and SiH3CN⋆,⋆⋆
1
Instituto de Ciencia de Materiales de Madrid, CSIC, C/ Sor Juana Inés de la Cruz 3,
28049
Cantoblanco, Spain
e-mail:
This email address is being protected from spambots. You need JavaScript enabled to view it.
2
Institut de Radioastronomie Millimétrique,
300 rue de la Piscine,
38406
St. Martin d’Héres,
France
Received:
6
July
2014
Accepted:
25
August
2014
Abstract
The carbon-star envelope IRC +10216 harbors a rich variety of molecules, with more than 80 detected to date. During the course of a λ 3 mm survey of IRC +10216 carried out with the IRAM 30-m telescope we have detected various weak lines, with antenna temperatures of a few mK, which we assign to rotational transitions of four new molecules. The observation of three lines of C5S confirms a previous tentative identification of this molecule based on a line at 24.0 GHz. We also report the tentative identification of three molecules not yet observed in space: MgCCH, the first metal acetylide detected in space, and NCCP and SiH3CN, the phosphorus and silicon analogs of cyanogen (NCCN) and methyl cyanide (CH3CN). We derive the following column densities: N(C5S) = (2−14) × 1012 cm-2 (depending on the rotational temperature adopted), N(MgCCH) = 2 × 1012 cm-2, N(NCCP) = 7 × 1011 cm-2, and N(SiH3CN) = 1012 cm-2. The S-bearing carbon chain C5S is less abundant than C3S, while MgCCH has an abundance in between that of MgNC and those of MgCN and HMgNC. On the other hand, NCCP and SiH3CN are the least abundant P- and Si-bearing molecules observed to date in IRC +10216. Based on the behavior of similar molecules it is likely that these four species are formed in the outer circumstellar layers of IRC +10216. We discuss possible gas-phase formation routes.
Key words: astrochemistry / circumstellar matter / stars: AGB and post-AGB / stars: carbon / stars: individual: IRC 10216 / radio lines: stars
Based on observations carried out with the IRAM 30 m telescope. IRAM is supported by INSU/CNRS (France), MPG (Germany) and IGN (Spain).
Appendix A is available in electronic form at http://www.aanda.org
© ESO, 2014
1. Introduction
The carbon-star envelope IRC +10216 is one of the richest molecular sources in the sky, with more than 80 molecules discovered to date. As the central star is at the tip of the AGB phase, the star is expelling matter at a high rate of ~2 × 10⁻⁵ M⊙ yr-1. Being relatively nearby (~130 pc), IRC +10216 is the prototypical carbon star. The inner wind is a factory of dust and relatively stable molecules, while in its outer layers the photochemistry driven by the penetration of interstellar UV photons produces a wealth of exotic molecules.
IRC +10216 has been intensively observed from cm to submm wavelengths, including various line surveys (see a review in Cernicharo et al. 2011). Because of the carbon-rich character of the star, the molecular inventory of the envelope is dominated by carbon chains such as polyyne and cyanopolyyne radicals (Cernicharo & Guélin 1996; Guélin et al. 1998), carbon chains containing sulfur or silicon (Cernicharo et al. 1987; Ohishi et al. 1989; Bell et al. 1993), exotic molecules containing phosphorus or metals (Halfen et al. 2008; Cabezas et al. 2013), and negatively charged carbon chains (McCarthy et al. 2006; Cernicharo et al. 2007; Agúndez et al. 2010).
In recent decades IRC +10216 has been widely observed with the 30-m telescope of the Institut de Radioastronomie Millimétrique (IRAM), covering most of the atmospheric spectral windows available at wavelengths of 3, 2, 1.3, and 0.9 mm. In particular, the line survey in the 3 mm band has reached a very high sensitivity in certain spectral regions, allowing the detection of very weak features at the level of a few mK of antenna temperature. Here we report various weak lines observed within the λ 3 mm band, three of which are assigned to C5S, confirming a previous tentative identification of this molecule based on a line at cm wavelengths (Bell et al. 1993), while others are tentatively attributed to the molecules MgCCH, NCCP, and SiH3CN.
2. Observations
The observations were carried out with the IRAM 30-m telescope located at Pico Veleta
(Spain) over the course of several sessions, most of them between 2002 and 2008 in the
context of a λ
3 mm line survey of IRC +10216 covering the frequency range 80−116 GHz. The full 3 mm line survey will be
published soon elsewhere (Cernicharo et al. in prep.). We used the old ABCD receivers,
currently replaced by EMIR receivers at the 30 m telescope. A SIS
(superconductor-insulator-superconductor) receiver operating at 3 mm was tuned in single
sideband mode, with a typical image rejection larger than 20 dB. Identification of image
side band lines was done by shifting the frequency of the local oscillator. We used the
wobbler switching observing mode with the secondary mirror nutating by 3−4′ at a rate of 0.5 Hz. We checked pointing and focus by
observing nearby planets and the quasar OJ 287. We used a filterbank back end with a
bandwidth of 512 MHz and a spectral resolution of 1.0 MHz. At the IRAM 30-m telescope the
intensity scale is calibrated using two absorbers at different temperatures and the
atmospheric transmission model (ATM; Cernicharo 1985;
Pardo et al. 2001). We express intensities in terms
of  , the antenna
temperature corrected for atmospheric absorption and for antenna ohmic and spillover losses.
The uncertainty in due to
calibration is estimated to be around 10%. The system temperature ranged from 100 to 150 K.
On source integration times ranged from 2 to 20 h, resulting in
rms noise
levels per 1 MHz channel ranging from less than 1 mK to 3 mK.
, the antenna
temperature corrected for atmospheric absorption and for antenna ohmic and spillover losses.
The uncertainty in due to
calibration is estimated to be around 10%. The system temperature ranged from 100 to 150 K.
On source integration times ranged from 2 to 20 h, resulting in
rms noise
levels per 1 MHz channel ranging from less than 1 mK to 3 mK.
3. Results and discussion
Line parameters observed in IRC +10216.
3.1. C5S
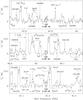 |
Fig. 1 Portions of the 3 mm line survey of IRC +10216 showing the J = 44−43,
J = 45−44, and J = 46−45 lines of C5S. The J = 44−43 line is
blended with lines of HC13C13CN and CCCC13CH. The
|

The molecule C5S
is a relatively heavy linear carbon chain with a  ground
electronic state, whose rotational spectrum has been recorded in the laboratory in the
5−18 GHz frequency range
(Kasai et al. 1993; Gordon et al. 2001). The electric dipole moment of this molecule has
been calculated as 4.65 D (Pascoli &
Lavendy 1998; Pérez-Juste et al. 2004). In
their observations of IRC +10216 using the NRAO 140-foot radiotelescope, Bell et al. (1993) reported the detection of a line at
23 990.2 MHz, which was tentatively assigned to the J = 13−12 rotational
transition of C5S.
To our knowledge, this tentative detection has been neither confirmed nor refuted by
subsequent studies.
ground
electronic state, whose rotational spectrum has been recorded in the laboratory in the
5−18 GHz frequency range
(Kasai et al. 1993; Gordon et al. 2001). The electric dipole moment of this molecule has
been calculated as 4.65 D (Pascoli &
Lavendy 1998; Pérez-Juste et al. 2004). In
their observations of IRC +10216 using the NRAO 140-foot radiotelescope, Bell et al. (1993) reported the detection of a line at
23 990.2 MHz, which was tentatively assigned to the J = 13−12 rotational
transition of C5S.
To our knowledge, this tentative detection has been neither confirmed nor refuted by
subsequent studies.
Various rotational transitions of C5S, with upper level energies Eup in the range 90−170 K, fall within the frequency coverage of our 3 mm line survey. We have identified three weak emission lines at the lower frequency side of the survey whose frequencies coincide with the J = 44−43 to J = 46−45 transitions of C5S. The next J lines are not detected either because they fall in spectral regions observed with an insufficient sensitivity or because they overlap with other strong lines (see Appendix A). The line parameters are listed in Table 1 and the lines are shown in Fig. 1. The agreement between calculated and observed frequencies is better than 1 MHz, which is good enough taking into account the moderate spectral resolution of the observed spectra (1 MHz) and the non negligible errors of some hundreds of kHz in the calculated frequencies at 3 mm (extrapolated from laboratory measurements at cm-wavelengths). In IRC +10216’s spectra, the J = 45−44 and J = 46−45 lines of C5S appear free of blending with other lines, although the J = 44−43 line overlaps partially with other weak lines arising from HC13C13CN and CCCC13CH.
Given the limited signal-to-noise ratio of the C5S lines it is difficult to appreciate a distinct line shape, either U-shaped or flat-topped, which could permit us to infer whether the size of the emitting region is smaller or larger than the main beam of the telescope at these frequencies (29−30′′). Based on the U-shaped line profiles observed at 3 mm for the related molecules C2S and C3S (Cernicharo et al. 1987), we could also expect an extended emission for C5S. Assuming a source size of radius 20′′, as most molecules distributed as a hollow shell in IRC +10216 (e.g., Guélin et al. 1997), and adopting the intensities of the three lines observed at 3 mm and that observed by Bell et al. (1993) at 24.0 GHz, we derive a column density N(C5S) of 1.4 × 1013 cm-2 and a rotational temperature Trot of 18 K. The column density is somewhat lower than that reported by Bell et al. (1993), mainly because of the lower source size adopted by these authors. The derived values of Trot and N(C5S) rely to a large extent on the 0.8 cm line (Eup = 8 K) observed by Bell et al. (1993). If we only consider the lines at 3 mm (Eup = 88−96 K) then Trot needs to be fixed and N(C5S) becomes very sensitive to the adopted choice of Trot. For example, for a rotational temperature of 44 K (as measured for the related molecule C3S; see Table 2) the column density of C5S decreases by almost one order of magnitude to 2 × 1012 cm-2. The 3 mm lines involve high energy levels and have Einstein coefficients for spontaneous emission (and thus critical densities) about 40 times higher than the 0.8 cm line, probably implying that they are subthermally excited in the outer layers of IRC +10216 and that C5S is not characterized by a uniform rotational temperature. For Trot = 18−44 K, we find that C5S has a column density in the range (2−14) × 1012 cm-2. Figure 1 shows the line profiles calculated under local thermodynamic equilibrium (LTE), adopting the parameters of the envelope from Agúndez et al. (2012) and assuming that C5S is present in a hollow shell extending from 5 to 20′′, with a homogeneous fractional abundance and rotational temperature of 18 K, which may be adequate for the 3 mm lines, as discussed above. The agreement between modeled and observed line profiles is fairly good.
Rotational temperatures and column densities.
The molecule C5S is the largest member of the series of sulfur-containing carbon chains CnS observed in space. The shorter members C2S and C3S are observed in various astronomical regions, although C4S has never been observed. The column densities derived for these molecules in IRC +10216 are listed in Table 2. In the cases of C2S and C3S, the column densities are quite robust as they result from a large number of rotational lines observed across the 3, 2, and 1.3 mm bands. That of C4S is just an upper limit while that of C5S has a large uncertainty. The uncertainty in the column density of C5S however could be reduced if sensitive observations are performed at frequencies around 40 GHz, where the brightest C5S lines are expected. This spectral region has been surveyed by Kawaguchi et al. (1995) although no line attributable to C5S was found, probably becaise of an insufficient sensitivity. The carbon chains CnS seem to show a decline in abundance as the length of the chain increases (albeit the uncertainty in the value of C5S), as occurs with polyacetylenic and cyanopolyacetilenic chains (see, e.g., Agúndez et al. 2008a). There is no obvious alternation in the abundance between chains with n odd (1Σ electronic ground state) and those with an even number of carbon atoms (3Σ electronic ground state), as may be occurring for the series CnO, of which only C3O, but not C2O, has been detected in IRC +10216 (Tenenbaum et al. 2006). It is also worth noting that the rotational temperature of C3S is more than twice that of C2S (see Table 2), which points to differences in the excitation and may be indicative of radiative pumping to vibrationally excited states playing an important role in the case of C3S (see, e.g., Agúndez et al. 2008a).
The chemical routes leading to S-bearing carbon chains in IRC +10216 have been
investigated by Millar et al. (2001), who find that
the synthesis is probably dominated by reactions of the type
 (1)for
S-containing carbon chains with an even number of carbon atoms, while those with an odd
number of carbon atoms would form through reactions of the type
(1)for
S-containing carbon chains with an even number of carbon atoms, while those with an odd
number of carbon atoms would form through reactions of the type
 (2)The model of
Millar et al. (2001) yields results in reasonable
agreement with our observed column densities of CnS chains,
although these are somewhat overestimated by the model probably because of the too high
initial abundance of CS adopted (4 ×
10-6 relative to H2), which may need to be revised
down by a factor of 5−6 (Agúndez et al. 2012).
(2)The model of
Millar et al. (2001) yields results in reasonable
agreement with our observed column densities of CnS chains,
although these are somewhat overestimated by the model probably because of the too high
initial abundance of CS adopted (4 ×
10-6 relative to H2), which may need to be revised
down by a factor of 5−6 (Agúndez et al. 2012).
3.2. MgCCH
A variety of metal cyanides have been observed in the circumstellar gas of IRC +10216.
Among these metal cyanides there are various involving magnesium, such as the isocyanic
and cyanic forms MgNC and MgCN (Guélin et al. 1986;
Kawaguchi et al. 1993; Ziurys et al. 1995), and the more recently detected hydrogenated
isocyanic form HMgNC (Cabezas et al. 2013). Metals
thus show a tendency to combine with cyanide radicals rather than other types of radicals
in IRC +10216. Because the ethynyl radical is as abundant as the cyanide radical in IRC
+10216, it is reasonable to expect that metal acetylides such as MgCCH could also be
present in the circumstellar gas. Magnesium monoacetylide (MgCCH) is a linear radical with
a  electronic ground state, whose pure rotational spectrum has been characterized in the
laboratory in the spectral range 315−525 GHz (Brewster et al. 1999).
MgCCH has a moderate electric dipole moment of 1.68 D, according to the ab initio
calculations of Woon (1996), which indicates that
the ethynyl-metal bond probably has a fair degree of covalent character.
electronic ground state, whose pure rotational spectrum has been characterized in the
laboratory in the spectral range 315−525 GHz (Brewster et al. 1999).
MgCCH has a moderate electric dipole moment of 1.68 D, according to the ab initio
calculations of Woon (1996), which indicates that
the ethynyl-metal bond probably has a fair degree of covalent character.
Three rotational transition doublets of MgCCH fall within our 3 mm line survey. The N = 9−8 at 89.3 GHz and the N = 10−9 at 99.3 GHz coincide in frequency with two pairs of non-blended weak lines (see Fig. 2), while the N = 11−10 at 109.2 GHz falls in a region where the sensitivity of the spectrum is insufficient to detect lines with antenna temperatures of a few mK (see Appendix A). The agreement between observed and calculated frequencies is reasonably good, less than 1 MHz (see Table 1). We must take into account however that the observed lines attributed to MgCCH are weak and the number of lines with similar intensities is relatively large in this region of the spectrum and at this level of sensitivity. The possibility of accidental coincidence cannot be completely ruled out although the assignment to MgCCH is reinforced by the fact that the transitions consist of doublets and both the N = 9−8 and N = 10−9 are observed free of blending. Nonetheless, for the moment we prefer to remain cautious and consider the detection of MgCCH as tentative, mainly because of the weakness of the observed lines.
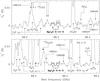 |
Fig. 2 Parts of the 3 mm line survey of IRC +10216 showing the pairs of lines tentatively
assigned to the N = 9−8 and N = 10−9 doublets of MgCCH. The
|
Despite the limited signal-to-noise ratio of the MgCCH lines observed, these seem to show a U-shaped profile, which would indicate that the size of the emission is comparable or larger than the main beam of the IRAM 30-m telescope at the observed frequencies (25−28′′). Magnesium isocyanide has been found to be distributed in the form of a hollow shell of radius 15−20′′, as mapped with the IRAM Plateau de Bure interferometer at millimeter wavelengths (Guélin et al. 1993). Based on the U-shaped profiles and the distribution of the related molecule MgNC we can assume a source size of radius 20′′ for MgCCH. Adopting a rotational temperature of 20 K, of the order of other molecules distributed in the outer layers of IRC +10216 (Cernicharo et al. 2000), we derive a column density N(MgCCH) of 2 × 1012 cm-2, that is, ~6 times less than MgNC and ~3 times above those of MgCN and HMgNC (Cabezas et al. 2013). As shown in Fig. 2, the MgCCH line profiles calculated under LTE, assuming a rotational temperature of 20 K, are in reasonable agreement with the observations.
The possible chemical routes leading to metal-containing molecules, including MgCCH, in the outer layers of IRC +10216 have been addressed in various studies (Woon 1996; Petrie 1996; Dunbar & Petrie 2002; Millar 2008). Various chemical pathways have been ruled out based on reaction endothermicities or on the lack of sufficiently abundant precursors in the circumstellar gas. From these studies, it turns out that the most likely formation route of MgCCH probably follows closely that proposed by Petrie (1996) for the synthesis of magnesium cyanides, which consists of the radiative association between Mg+ and large cyanopolyynes followed by the dissociative recombination of the ionic complex with free electrons. In the case of MgCCH, the radiative recombination would take place between Mg+ and large polyynes, leading to Mg(CnH2)+ complexes, whose recombination with electrons could yield MgCCH, among other possible fragments. A simple chemical model similar to that described in Cabezas et al. (2013), adopting the rate constants of radiative association between Mg+ and polyynes calculated by Dunbar & Petrie (2002), indicates that this route is capable of producing MgCCH with an abundance high enough to account for the column density derived from observations. An alternative route could be the exchange reaction between MgNC and CCH to yield MgCCH and CN (the precursor MgNC being about six times more abundant than MgCCH in IRC +10216), although theoretical calculations do not conclude whether this reaction is slightly endothermic or slightly exothermic (Woon 1996). Other metal acetylides could be present in IRC +10216, although they may be difficult to detect if, as found in the case of Mg, they are less abundant than the corresponding (iso)cyanides. For example, AlNC is detected in IRC +10216 (Ziurys et al. 2002) but not AlCCH, with N(AlCCH)/N(AlNC) ≲ 22 (Cabezas et al. 2012). The low dipole moment of AlCCH (~0.6 D) makes it difficult to impose a stringent upper limit on its abundance.
3.3. NCCP
From a chemical point of view, cyanophosphaethyne (NCCP) can be viewed as a cyanogen molecule (NCCN) in which a nitrogen atom has been substituted by a phosphorus atom. From a spectroscopic point of view, NCCP is a linear molecule with a closed-shell singlet electronic ground state. Its pure rotational spectrum has been characterized in the laboratory over a broad spectral range, from 25 to 820 GHz (Bizzocchi et al. 2001). Having a moderately large dipole moment of 3.44 D, as measured by Cooper et al. (1980), it has been suggested that this molecule could be a good candidate for detection in astronomical sources such as IRC +10216 (Bizzocchi et al. 2001), where other P-bearing molecules such as CP, PN, HCP, PH3, and CCP have already been detected (Guélin et al. 1990, 2000; Agúndez et al., 2007, 2008b, 2014; Milam et al. 2008; Tenenbaum & Ziurys 2008; Halfen et al. 2008).
Seven rotational lines of NCCP from J = 15−14 to J = 21−20, with upper
level energies in the range 30−60 K, fall within the 3 mm line survey. A weak line with
 mK
lying at 97 355.7 ± 1 MHz
coincides in frequency, within less than 1 MHz, with the J = 18−17 transition of
NCCP (see Table 1 and Fig. 3). To confirm whether this assignment is correct we have searched for
other rotational transitions of NCCP within the 3 mm band. A weak line at 81 131.9 ± 1 MHz, lying in one of the most
sensitive regions of the 3 mm spectrum, might be assigned to the J = 15−14 transition
while the J = 16−15 can be identified with a marginal line at 86 539.5 ± 1 MHz. The remaining transitions
of NCCP within the 3 mm band either fall in regions where the sensitivity achieved is
insufficient to detect such weak lines or are affected by severe blendings with other
strong lines (see Appendix A). The agreement
between calculated and observed frequencies is reasonably good and, within the sensitivity
reached, we do not find missing lines in the 3 mm line survey. On the other hand, line
confusion and accidental coincidence may be an issue at this level of sensitivity in the 3
mm spectra of IRC +10216. We must therefore be cautious and consider the identification of
NCCP as tentative.
mK
lying at 97 355.7 ± 1 MHz
coincides in frequency, within less than 1 MHz, with the J = 18−17 transition of
NCCP (see Table 1 and Fig. 3). To confirm whether this assignment is correct we have searched for
other rotational transitions of NCCP within the 3 mm band. A weak line at 81 131.9 ± 1 MHz, lying in one of the most
sensitive regions of the 3 mm spectrum, might be assigned to the J = 15−14 transition
while the J = 16−15 can be identified with a marginal line at 86 539.5 ± 1 MHz. The remaining transitions
of NCCP within the 3 mm band either fall in regions where the sensitivity achieved is
insufficient to detect such weak lines or are affected by severe blendings with other
strong lines (see Appendix A). The agreement
between calculated and observed frequencies is reasonably good and, within the sensitivity
reached, we do not find missing lines in the 3 mm line survey. On the other hand, line
confusion and accidental coincidence may be an issue at this level of sensitivity in the 3
mm spectra of IRC +10216. We must therefore be cautious and consider the identification of
NCCP as tentative.
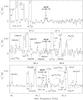 |
Fig. 3 Parts of the 3 mm line survey of IRC +10216 showing the three lines tentatively
assigned to the J = 15−14, J
= 16−15, and J = 18−17 rotational lines of NCCP. The
J = 16−15 line is marginally detected. The
|
Given the limited signal-to-noise ratio of the three lines assigned to NCCP, it is difficult to distinguish whether the line profiles are more U-shaped or flat-topped. Assuming that this molecule is formed in the outer layers, as seems to be the case of the related radical CCP (Halfen et al. 2008), we may adopt for NCCP a distribution size with a radius of 20′′ and a rotational temperature of 20 K, typical parameters for molecules distributed in the outer shells. The column density of NCCP derived is then 7 × 1011 cm-2, about 50−100 times less abundant than CP and slightly less abundant than CCP. The column densities of CP and CCP in IRC +10216 are in the ranges 3.9−8 × 10¹³ and 1.2−2.9 × 1012 cm-2, respectively, according to Guélin et al. (1990), Halfen et al. (2008), and an analysis of our IRAM 30-m data. As can be seen in Fig. 3, the line profiles of NCCP calculated under LTE assuming a rotational temperature of 20 K show a good agreement with the observed line profiles.
The chemistry of phosphorus-containing molecules in circumstellar envelopes such as IRC
+10216 has been discussed by MacKay &
Charnley (2001) and Agúndez et al. (2007),
although the formation of NCCP has not yet been addressed. Little is known about the
chemical kinetics of this species. We can imagine that formation routes similar to those
yielding cyanogen (NCCN), which are better studied, could also work for NCCP. The
formation of NCCN in the reaction of HCN and CN does not occur at low temperatures because
of an activation barrier (Yang et al. 1992),
although the reaction between HNC and CN may provide an efficient formation route to NCCN
as long as the reaction is barrierless and both HNC and CN are abundant in IRC +10216
(Petrie et al. 2003). Unfortunately, NCCN does
not have a permanent dipole moment and cannot be detected through its rotational spectrum.
By analogy with NCCN, we can imagine that NCCP might be efficiently formed in IRC +10216
through the reaction  (3)which is slightly
exothermic, by ~15 kcal
mol-1 adopting
the formation enthalpy of NCCP from Pham-Tran
et al. (2001), and whose reactants are abundant enough in IRC +10216.
(3)which is slightly
exothermic, by ~15 kcal
mol-1 adopting
the formation enthalpy of NCCP from Pham-Tran
et al. (2001), and whose reactants are abundant enough in IRC +10216.
3.4. SiH3CN
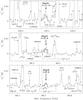 |
Fig. 4 Portions of the 3 mm line survey of IRC +10216 showing the J = 9−8 to
J = 11−10 rotational lines of SiH3CN. Each J line is composed of
a set of K components whose line profiles overlap. The
K = 0
and 1 components, being the strongest, are indicated by arrows. The
|
Silyl cyanide, SiH3CN, is a prolate rotor with a closed electronic shell. Its rotational spectrum has been recorded in the laboratory at microwave and millimeter wavelengths and its electric dipole moment has been experimentally determined to be as large as 3.44 D (Priem et al. 1998).
Three rotational transitions of SiH3CN fall within the 3 mm line survey, J = 9−8 to J = 11−10, and the three can be identified with weak emission features in the observed spectrum. Because lines are relatively broad in IRC +10216, ~29 km s-1 or ~10 MHz at 3 mm, each transition of SiH3CN is expected to show a complex profile resulting from the overlap of the different K components (K = 0 and 1 being the strongest). Figure 4 shows the SiH3CN lines while Table 1 lists the line parameters. Only the positions of the K = 0 and 1 components are indicated. The J = 9−8 line appears free of blend with other lines, although the J = 10−9 and J = 11−10 overlap partially at the red side with a weak line of C5N in its ν5 = 1 vibrational state. Moreover, in the case of the J = 10−9 line the emission feature observed implies that there must be a weak overlapping unidentified line at ~99 457 MHz. The computation of the line profiles expected for SiH3CN helps to bring some light into the interpretation of the observed emission features. Assuming that SiH3CN is distributed as a hollow shell of radius between 5 and 20′′ with a homogeneous rotational temperature of 39 K, that derived for the related molecule CH3CN according to our IRAM 30-m data, a LTE excitation calculation yields the line profiles shown in Fig. 4. It is seen that the line profiles of SiH3CN are dominated by the K = 0 and 1 components with minor contributions from higher K components at lower frequencies. The observed emission features cannot be fully explained by the C5N ν5 = 1 lines and the unidentified line at 99 457 MHz, and thus are consistent with the presence of SiH3CN. However, because two of the three observed transitions of SiH3CN are partially blended with other lines and because of the limited signal-to-noise ratio achieved, for the moment we consider the identification of SiH3CN in IRC +10216 as tentative.
A relatively low column density of 1012 cm-2 is derived for SiH3CN adopting a rotational temperature of 39 K and a source size of radius 20′′, which makes SiH3CN the least abundant Si-containing molecule detected to date in IRC +10216. The column density of SiH3CN is comparable to, although somewhat below, that of SiCN and SiNC (~2 × 1012 cm-2; Guélin et al. 2000, 2004). The synthesis of SiH3CN is quite uncertain, although the analogous species CH3CN has been better studied. A quite direct synthetic pathway to CH3CN would be the reaction between CH4 and CN although it has an activation barrier and thus becomes too slow at low temperatures (Sims et al. 1993). In the absence of better constraints we could expect that the route to SiH3CN from SiH4 and CN is also probably closed at low temperatures. A more efficient route to CH3CN in IRC +10216 involves the ion CH3CNH+, whose dissociative recombination with electrons yields both CH3CN and CH2CN (Agúndez et al. 2008a). In the case of SiH3CN, a similar route involving the ion SiH3CNH+ could also work, although the details about the chemical kinetics of the reactions involved are yet to be investigated.
4. Summary
We have detected various weak lines in the course of an IRAM 30-m λ 3 mm line survey of IRC +10216. Three of these lines are identified with rotational transitions of C5S, confirming a previous tentative detection of this molecule by Bell et al. (1993) based on a line at 0.8 cm. Some other weak lines are tentatively assigned to rotational transitions of three new molecules not yet observed in space. These three molecules are MgCCH, the first metal acetylide detected in space, and NCCP and SiH3CN, two exotic molecules which are the phosphorus and silicon analogs of cyanogen (NCCN) and methyl cyanide (CH3CN).
The S-bearing carbon chain C5S is likely to have a non-uniform rotational temperature, with values in the range 18−44 K, which translates to column densities in the range (2−14) × 1012 cm-2, implying that C5S is less abundant than C3S in the envelope of IRC +10216. For MgCCH, NCCP, and SiH3CN we derive column densities of the order of 1012 cm-2, which implies that MgCCH has an abundance in between that of MgNC and those of MgCN and HMgNC, while NCCP and SiH3CN become the least abundant P- and Si-bearing molecules observed to date in IRC +10216.
Based on the behavior of similar molecules, it is likely that the four molecules are formed in the outer circumstellar layers of IRC +10216. The molecule C5S is probably formed in a similar fashion as other sulfur-containing carbon chains such as C3S, while that of MgCCH probably takes place through chemical routes similar to those proposed for the formation of metal cyanides. The formation of NCCP and SiH3CN is more uncertain and is suggested to occur through analogous pathways as those leading to NCCN and CH3CN.
The identification of these four molecules through such weak lines suggests that pushing observations toward very low noise levels will probably bring a good number of molecular discoveries in chemically rich environments such as IRC +10216.
Online material
Appendix A: Spectra covering detected and non-detected lines in the 3 mm band
In the case of silyl cyanide, the three rotational transitions covered within the 3 mm band are observed, but not all rotational transitions lying in the 3 mm band (80−116 GHz) are detected for C5S, MgCCH, and NCCP. The lines that are not detected either fall in spectral regions where the sensitivity achieved is not good enough or are blended with stronger lines of other molecules.
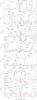 |
Fig. A.1 Spectra covering the C5S lines in the 80−93 GHz frequency range. Detected lines are indicated by red arrows and non-detected lines by red dashed lines. LTE calculated line profiles are shown in red. |
In Fig. A.1, we show the spectra covering the J = 44−43 to J = 50−49 rotational transitions of C5S, lying in the low frequency side (80−93 GHz) of the 3 mm band. Only the three rotational transitions lying on the lowest frequencies (J = 44−43, J = 45 −44, and J = 46−45) are detected (lines also shown in Fig. 1 and already discussed in Sect. 3.1). The spectral regions where the next higher J lines of C5S are expected are shown in the upper panels of Fig. A.1. None of these transitions can be identified with clear emission features in the observed spectra. The spectral region around the J = 47−46 and J = 49−48 transitions are relatively noisy. The antenna temperature rms noise level per 1 MHz channel is 1.5 mK around the J = 47−46 transition, while the expected C5S line intensity is similar, making very difficult to ascertain whether or not the weak C5S line is present. The situation is even worse for the J = 49−48 transition, with an expected antenna temperature of just ~1 mK and a rms noise level of 1.8 mK per 1 MHz channel. The J = 48−47 and J = 50−49 transitions of C5S are severely blended with other much stronger lines. At higher frequencies, the chances of observing a C5S line become lower because the expected C5S line intensities decrease as J increases (C5S is a quite heavy rotor and levels with J> 50 become poorly populated at rotational temperatures around 20 K) and also because in our 3 mm line survey of IRC +10216 spectra usually become less sensitive with increasing frequency.
As concerns the molecule MgCCH, there are three doublets of rotational transitions lying
within the 3 mm band (see Fig. A.2). The two doublets
lying at lower frequencies are identified with weak emission features (see also Fig. 2 and Sect. 3.2),
but the doublet lying at 109.2 GHz, corresponding to the N = 11−10 rotational
transition, cannot be clearly distinguised in the 3 mm line survey data. The low frequency
component of this doublet is completely blended with a stronger line arising from a
hyperfine component of the NJ = 12−01 rotational transition of 13CN, while the high frequency
component cannot be appreciated due to an insufficient sensitivity (the
rms noise
level is 1.8 mK per 1 MHz in this spectral region and the MgCCH component is expected with
an intensity of just ~1.5 mK).
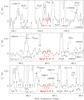 |
Fig. A.2 Spectra covering the MgCCH lines in the 3 mm band. Detected lines are indicated by red arrows and non-detected lines by red dashed lines. LTE calculated line profiles are shown in red. |
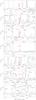 |
Fig. A.3 Spectra covering the NCCP lines in the 3 mm band. Detected lines are indicated by red arrows and non-detected lines by red dashed lines. LTE calculated line profiles are shown in red. |
The linear rotor NCCP has also several rotational transitions lying in the 80−116 GHz range (see Fig. A.3), from which only three (J = 15−14, J = 16−15, and J = 18−17) are identified with weak emission features (see also Fig. 3 and Sect. 3.3). The J = 17−16 transition falls in a spectral region crowded by stronger lines arising from CH13CN, an unidentified line at 91 953 MHz, and CH3CN, making very difficult to infer its presence. The J = 19−18 transition is partially blended with a stronger line corresponding to C5N−, and in any case, the limited sensitivity of the spectrum (rms of 1.5 mK per 1 MHz) makes it very difficult to distinguish the NCCP line from the noise. An even worse situation occurs in the case of the J = 20−19 transition, which falls in a spectral region where it partially overlaps with a line of C2P and the data is quite noisy (rms of 2.1 mK per 1 MHz). The last transition of NCCP within the 3 mm band is the J = 21−20, which falls in a spectral region where the noise level is moderately low (rms of 1.1 mK per 1 MHz if we do not consider the much noiser region at frequencies higher than 113 600 MHz), although it is not low enough to allow for a clear detection of lines with antenna temperatures of ~1 mK, as expected for this NCCP line.
Acknowledgments
M.A. and J.C. thank Spanish MINECO for funding support through grants CSD2009-00038, AYA2009-07304, and AYA2012-32032. We thank the anonymous referee for a critical and constructive report.
References
- Agúndez, M., Cernicharo, J., & Guélin, M. 2007, ApJ, 662, L91 [NASA ADS] [CrossRef] [Google Scholar]
- Agúndez, M., Fonfría, J. P., Cernicharo, J., et al. 2008a, A&A, 479, 493 [NASA ADS] [CrossRef] [EDP Sciences] [Google Scholar]
- Agúndez, M., Cernicharo, J., Pardo, J. R., et al. 2008b, A&A, 485, L33 [NASA ADS] [CrossRef] [EDP Sciences] [Google Scholar]
- Agúndez, M., Cernicharo, J., Guélin, M., et al. 2010, A&A, 517, L2 [NASA ADS] [CrossRef] [EDP Sciences] [Google Scholar]
- Agúndez, M., Fonfría, J. P., Cernicharo, J., et al. 2012, A&A, 543, A48 [NASA ADS] [CrossRef] [EDP Sciences] [Google Scholar]
- Agúndez, M., Cernicharo, J., Decin, L., et al. 2014, ApJ, 790, L27 [NASA ADS] [CrossRef] [Google Scholar]
- Bell, M. B., Avery, L. W., & Feldman, P. A. 1993, ApJ, 417, L37 [NASA ADS] [CrossRef] [Google Scholar]
- Bizzocchi, L., Thornwirth, S., Müller, H. S. P., et al. 2001, J. Mol. Spectr., 205, 110 [NASA ADS] [CrossRef] [Google Scholar]
- Brewster, M. A., Apponi, A. J., Xin, J., & Ziurys, L. M. 1999, Chem. Phys. Lett., 310, 411 [NASA ADS] [CrossRef] [Google Scholar]
- Cabezas, C., Mata, S., Daly, A. M., et al. 2012, J. Mol. Spectr., 278, 31 [NASA ADS] [CrossRef] [Google Scholar]
- Cabezas, C., Cernicharo, J., Alonso, J. L., et al. 2013, ApJ, 775, 133 [NASA ADS] [CrossRef] [Google Scholar]
- Cernicharo, J. 1985, IRAM Internal Report 52 [Google Scholar]
- Cernicharo, J., & Guélin, M. 1996, A&A, 309, L27 [NASA ADS] [Google Scholar]
- Cernicharo, J., Guélin, M., Hein, H., & Kahane, C. 1987, A&A, 181, L9 [NASA ADS] [Google Scholar]
- Cernicharo, J., Guélin, M., & Kahane, C. 2000, A&AS, 142, 181 [NASA ADS] [CrossRef] [EDP Sciences] [Google Scholar]
- Cernicharo, J., Guélin, M., Agúndez, M., et al. 2007, A&A, 467, L37 [NASA ADS] [CrossRef] [EDP Sciences] [Google Scholar]
- Cernicharo, J., Agúndez, M., & Guélin, M. 2011, in The Molecular Universe, eds. J. Cernicharo, & R. Bachiller (Cambridge Univ. Press), IAU Symp., 280, 237 [Google Scholar]
- Cooper, T. A., Kroto, H. W., Nixon, J. F., & Ohashi, O. 1980, J. Chem. Soc. Chem. Commun., 8, 333 [CrossRef] [Google Scholar]
- Dunbar, R. C., & Petrie, S. 2002, ApJ, 564, 792 [NASA ADS] [CrossRef] [Google Scholar]
- Gordon, V. D., McCarthy, M. C., Apponi, A. J., & Thaddeus, P. 2001, ApJS, 134, 311 [NASA ADS] [CrossRef] [Google Scholar]
- Guélin, M., Gómez-González, J., Cernicharo, J., & Kahane, C. 1986, A&A, 157, L17 [NASA ADS] [Google Scholar]
- Guélin, M., Cernicharo, J., Paubert, G., & Turner, B. E. 1990, A&A, 230, L9 [NASA ADS] [Google Scholar]
- Guélin, M., Lucas, R., & Cernicharo, J. 1993, A&A, 280, L19 [NASA ADS] [Google Scholar]
- Guélin, M., Lucas, R., & Neri, R. 1997, in CO: Twenty-Five Years of Millimeter Wave Spectroscopy, eds. W. B. Latter, et al. (Dordrecht: Kluwer), IAU Symp., 170, 359 [Google Scholar]
- Guélin, M., Neininger, N., & Cernicharo, J. 1998, A&A, 335, L1 [NASA ADS] [Google Scholar]
- Guélin, M., Muller, S., Cernicharo, J., et al. 2000, A&A, 363, L9 [NASA ADS] [Google Scholar]
- Guélin, M., Muller, S., Cernicharo, J., et al. 2004, A&A, 426, L49 [NASA ADS] [CrossRef] [EDP Sciences] [Google Scholar]
- Halfen, D. T., Clouthier, D. J., & Ziurys, L. M. 2008, ApJ, 677, L101 [NASA ADS] [CrossRef] [Google Scholar]
- Kasai, Y., Obi, K., Ohshima, Y., et al. 1993, ApJ, 410, L45 [NASA ADS] [CrossRef] [Google Scholar]
- Kawaguchi, K., Kagi, E., Hirano, T., et al. 1993, ApJ, 406, L39 [NASA ADS] [CrossRef] [Google Scholar]
- Kawaguchi, K., Kasai, Y., Ishikawa, S.-I., & Kaifu, N. 1995, PASJ, 47, 853 [Google Scholar]
- MacKay, D. D. S., & Charnley, S. B. 2001, MNRAS, 325, 545 [NASA ADS] [CrossRef] [Google Scholar]
- McCarthy, M. C., Gottlieb, C. A., Gupta, H., & Thaddeus, P. 2006, ApJ, 652, L141 [NASA ADS] [CrossRef] [Google Scholar]
- Milam, S. N., Halfen, D. T., Tenenbaum, E. D., et al. 2008, ApJ, 684, 618 [NASA ADS] [CrossRef] [Google Scholar]
- Millar, T. J. 2008, Ap&SS, 313, 223 [NASA ADS] [CrossRef] [Google Scholar]
- Millar, T. J., Flores, J. R., & Markwick, A. J. 2001, MNRAS, 327, 1173 [NASA ADS] [CrossRef] [Google Scholar]
- Ohishi, M., Kaifu, N., Kawaguchi, K., et al. 1989, ApJ, 435, L83 [NASA ADS] [CrossRef] [Google Scholar]
- Pardo, J. R., Cernicharo, J., & Serabyn, E. 2001, IEEE Trans. Antennas Propag., 49, 1683 [Google Scholar]
- Pascoli, G., & Lavendy, H. 1998, Int. J. Mass Spectr., 181, 11 [Google Scholar]
- Pérez-Juste, I., Graña, A. M., Carballeira, L., & Mosquera, R. A. 2004, J. Chem. Phys., 121, 10447 [NASA ADS] [CrossRef] [Google Scholar]
- Petrie, S. 1996, MNRAS, 282, 807 [NASA ADS] [CrossRef] [Google Scholar]
- Petrie, S., Millar, T. J., & Markwick, A. J. 2003, MNRAS, 341, 609 [NASA ADS] [CrossRef] [Google Scholar]
- Pham-Tran, N.-N., Hajgató, B., Veszprémi, T., & Nguyen, M. T. 2001, Phys. Chem. Chem. Phys., 3, 1588 [CrossRef] [Google Scholar]
- Priem, D., Cosléou, J., Demaison, J., et al. 1998, J. Mol. Spectr., 191, 183 [NASA ADS] [CrossRef] [Google Scholar]
- Sims, I. R., Queffelec, J.-L., Travers, D., et al. 1993, Chem. Phys. Lett., 211, 461 [NASA ADS] [CrossRef] [Google Scholar]
- Tenenbaum, E. D., & Ziurys, L. M. 2008, ApJ, 680, L121 [NASA ADS] [CrossRef] [Google Scholar]
- Tenenbaum, E. D., Apponi, A. J., Ziurys, L. M., et al. 2006, ApJ, 649, L17 [NASA ADS] [CrossRef] [Google Scholar]
- Woon, D. E. 1996, ApJ, 456, 602 [NASA ADS] [CrossRef] [Google Scholar]
- Yang, D. L., Yu, T., Lin, M. C., & Melius, C. F. 1992, J. Chem. Phys., 97, 222 [NASA ADS] [CrossRef] [Google Scholar]
- Ziurys, L. M., Apponi, A. J., Guélin, M., & Cernicharo, J. 1995, ApJ, 445, L47 [NASA ADS] [CrossRef] [Google Scholar]
- Ziurys, L. M., Savage, C., Highberger, J. L., et al. 2002, ApJ, 564, L45 [NASA ADS] [CrossRef] [Google Scholar]
All Tables
All Figures
|
Fig. 1 Portions of the 3 mm line survey of IRC +10216 showing the J = 44−43,
J = 45−44, and J = 46−45 lines of C5S. The J = 44−43 line is
blended with lines of HC13C13CN and CCCC13CH. The
|
| In the text | |
|
Fig. 2 Parts of the 3 mm line survey of IRC +10216 showing the pairs of lines tentatively
assigned to the N = 9−8 and N = 10−9 doublets of MgCCH. The
|
| In the text | |
|
Fig. 3 Parts of the 3 mm line survey of IRC +10216 showing the three lines tentatively
assigned to the J = 15−14, J
= 16−15, and J = 18−17 rotational lines of NCCP. The
J = 16−15 line is marginally detected. The
|
| In the text | |
|
Fig. 4 Portions of the 3 mm line survey of IRC +10216 showing the J = 9−8 to
J = 11−10 rotational lines of SiH3CN. Each J line is composed of
a set of K components whose line profiles overlap. The
K = 0
and 1 components, being the strongest, are indicated by arrows. The
|
| In the text | |
|
Fig. A.1 Spectra covering the C5S lines in the 80−93 GHz frequency range. Detected lines are indicated by red arrows and non-detected lines by red dashed lines. LTE calculated line profiles are shown in red. |
| In the text | |
|
Fig. A.2 Spectra covering the MgCCH lines in the 3 mm band. Detected lines are indicated by red arrows and non-detected lines by red dashed lines. LTE calculated line profiles are shown in red. |
| In the text | |
|
Fig. A.3 Spectra covering the NCCP lines in the 3 mm band. Detected lines are indicated by red arrows and non-detected lines by red dashed lines. LTE calculated line profiles are shown in red. |
| In the text | |
Current usage metrics show cumulative count of Article Views (full-text article views including HTML views, PDF and ePub downloads, according to the available data) and Abstracts Views on Vision4Press platform.
Data correspond to usage on the plateform after 2015. The current usage metrics is available 48-96 hours after online publication and is updated daily on week days.
Initial download of the metrics may take a while.