| Issue |
A&A
Volume 570, October 2014
|
|
|---|---|---|
| Article Number | A45 | |
| Number of page(s) | 9 | |
| Section | Interstellar and circumstellar matter | |
| DOI | https://doi.org/10.1051/0004-6361/201424542 | |
| Published online | 15 October 2014 | |
Online material
Appendix A: Spectra covering detected and non-detected lines in the 3 mm band
In the case of silyl cyanide, the three rotational transitions covered within the 3 mm band are observed, but not all rotational transitions lying in the 3 mm band (80−116 GHz) are detected for C5S, MgCCH, and NCCP. The lines that are not detected either fall in spectral regions where the sensitivity achieved is not good enough or are blended with stronger lines of other molecules.
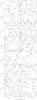 |
Fig. A.1
Spectra covering the C5S lines in the 80−93 GHz frequency range. Detected lines are indicated by red arrows and non-detected lines by red dashed lines. LTE calculated line profiles are shown in red. |
| Open with DEXTER | |
In Fig. A.1, we show the spectra covering the J = 44−43 to J = 50−49 rotational transitions of C5S, lying in the low frequency side (80−93 GHz) of the 3 mm band. Only the three rotational transitions lying on the lowest frequencies (J = 44−43, J = 45 −44, and J = 46−45) are detected (lines also shown in Fig. 1 and already discussed in Sect. 3.1). The spectral regions where the next higher J lines of C5S are expected are shown in the upper panels of Fig. A.1. None of these transitions can be identified with clear emission features in the observed spectra. The spectral region around the J = 47−46 and J = 49−48 transitions are relatively noisy. The antenna temperature rms noise level per 1 MHz channel is 1.5 mK around the J = 47−46 transition, while the expected C5S line intensity is similar, making very difficult to ascertain whether or not the weak C5S line is present. The situation is even worse for the J = 49−48 transition, with an expected antenna temperature of just ~1 mK and a rms noise level of 1.8 mK per 1 MHz channel. The J = 48−47 and J = 50−49 transitions of C5S are severely blended with other much stronger lines. At higher frequencies, the chances of observing a C5S line become lower because the expected C5S line intensities decrease as J increases (C5S is a quite heavy rotor and levels with J> 50 become poorly populated at rotational temperatures around 20 K) and also because in our 3 mm line survey of IRC +10216 spectra usually become less sensitive with increasing frequency.
As concerns the molecule MgCCH, there are three doublets of rotational transitions lying
within the 3 mm band (see Fig. A.2). The two doublets
lying at lower frequencies are identified with weak emission features (see also Fig. 2 and Sect. 3.2),
but the doublet lying at 109.2 GHz, corresponding to the N = 11−10 rotational
transition, cannot be clearly distinguised in the 3 mm line survey data. The low frequency
component of this doublet is completely blended with a stronger line arising from a
hyperfine component of the NJ = 12−01 rotational transition of 13CN, while the high frequency
component cannot be appreciated due to an insufficient sensitivity (the
 rms noise
level is 1.8 mK per 1 MHz in this spectral region and the MgCCH component is expected with
an intensity of just ~1.5 mK).
rms noise
level is 1.8 mK per 1 MHz in this spectral region and the MgCCH component is expected with
an intensity of just ~1.5 mK).
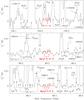 |
Fig. A.2
Spectra covering the MgCCH lines in the 3 mm band. Detected lines are indicated by red arrows and non-detected lines by red dashed lines. LTE calculated line profiles are shown in red. |
| Open with DEXTER | |
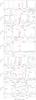 |
Fig. A.3
Spectra covering the NCCP lines in the 3 mm band. Detected lines are indicated by red arrows and non-detected lines by red dashed lines. LTE calculated line profiles are shown in red. |
| Open with DEXTER | |
The linear rotor NCCP has also several rotational transitions lying in the 80−116 GHz range (see Fig. A.3), from which only three (J = 15−14, J = 16−15, and J = 18−17) are identified with weak emission features (see also Fig. 3 and Sect. 3.3). The J = 17−16 transition falls in a spectral region crowded by stronger lines arising from CH13CN, an unidentified line at 91 953 MHz, and CH3CN, making very difficult to infer its presence. The J = 19−18 transition is partially blended with a stronger line corresponding to C5N−, and in any case, the limited sensitivity of the spectrum (rms of 1.5 mK per 1 MHz) makes it very difficult to distinguish the NCCP line from the noise. An even worse situation occurs in the case of the J = 20−19 transition, which falls in a spectral region where it partially overlaps with a line of C2P and the data is quite noisy (rms of 2.1 mK per 1 MHz). The last transition of NCCP within the 3 mm band is the J = 21−20, which falls in a spectral region where the noise level is moderately low (rms of 1.1 mK per 1 MHz if we do not consider the much noiser region at frequencies higher than 113 600 MHz), although it is not low enough to allow for a clear detection of lines with antenna temperatures of ~1 mK, as expected for this NCCP line.
© ESO, 2014
Current usage metrics show cumulative count of Article Views (full-text article views including HTML views, PDF and ePub downloads, according to the available data) and Abstracts Views on Vision4Press platform.
Data correspond to usage on the plateform after 2015. The current usage metrics is available 48-96 hours after online publication and is updated daily on week days.
Initial download of the metrics may take a while.