Free Access
Fig. 3
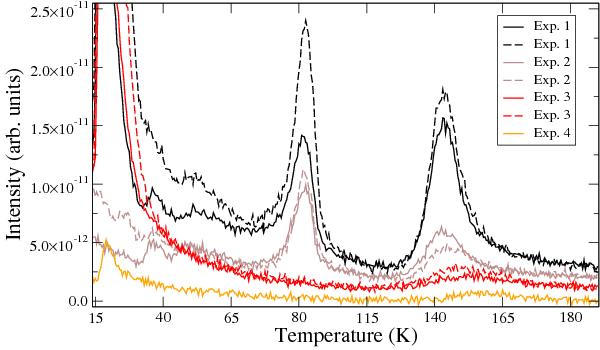
QMS traces of mass 20 amu for experiments 1–4 from Table 2. Spectra are baseline corrected, offset for clarity, and binned by averaging 5 points. Experiments 1–3 have been performed twice, hence two traces are depicted by the solid and dashed lines.
Current usage metrics show cumulative count of Article Views (full-text article views including HTML views, PDF and ePub downloads, according to the available data) and Abstracts Views on Vision4Press platform.
Data correspond to usage on the plateform after 2015. The current usage metrics is available 48-96 hours after online publication and is updated daily on week days.
Initial download of the metrics may take a while.