Fig. 2
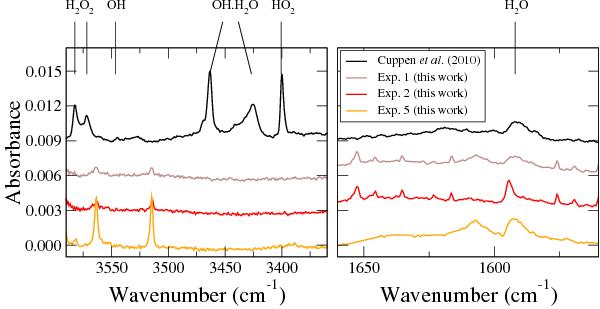
RAIR difference spectra from a co-deposition of H and 16O2 from Cuppen et al. (2010), H2, CO2 and 18O (experiment 1), CO2 and 18O (experiment 2). Spectra are baseline corrected and offset for clarity. The spectra corresponding to experiments 1, 2 and 5 are scaled with a factor 3. Note that the multitude of peaks in the right panel for experiments 1 and 2 are due to water vapor in the setup, and the peaks at 3515 and 3564 cm-1 are also visible in a “pure” CO2 spectrum.
Current usage metrics show cumulative count of Article Views (full-text article views including HTML views, PDF and ePub downloads, according to the available data) and Abstracts Views on Vision4Press platform.
Data correspond to usage on the plateform after 2015. The current usage metrics is available 48-96 hours after online publication and is updated daily on week days.
Initial download of the metrics may take a while.