| Issue |
A&A
Volume 570, October 2014
|
|
|---|---|---|
| Article Number | A126 | |
| Number of page(s) | 19 | |
| Section | Extragalactic astronomy | |
| DOI | https://doi.org/10.1051/0004-6361/201424232 | |
| Published online | 03 November 2014 | |
Spectroscopy of BL Lacertae objects of extraordinary luminosity⋆,⋆⋆
1
INAF – Osservatorio Astronomico di Brera, via Bianchi 46, 23807 Merate ( LC),
Italy
e-mail:
This email address is being protected from spambots. You need JavaScript enabled to view it.
2
INAF – Istituto Nazionale di Astrofisica and INFN – Istituto Nazionale di
Fisica Nucleare, Italy
3
INAF – Osservatorio Astronomico di Padova, Vicolo dell’
Osservatorio 5, 35122
Padova,
Italy
4
Università degli Studi dell’Insubria, via Valleggio 11, 22100
Como,
Italy
Received: 19 May 2014
Accepted: 10 July 2014
Abstract
Aims. We aim to determine the redshift (or stringent lower limits) of a number of bright BL Lacs objects.
Methods. We secured optical and near-infrared medium-resolution spectra of four bright BL Lac objects of unknown redshift using the spectrograph X-Shooter at the ESO-VLT.
Results. In spite of the high quality of the spectra and the extended spectral range of the observations, we have not detected intrisic spectral features for these sources. However, we are able to provide strigent lower limits to their redshift. In particular, for the two TeV sources PG 1553+113 and H 1722+119, we infer z> 0.30 and z> 0.35 respectively. We also detect an intervening Ca II absorption doublet in the spectrum of MH 2136-428 that is ascribed to the halo of a nearby giant elliptical galaxy at a projected distance of ~100 kpc.
Conclusions. Under the hypothesis that all BL Lacs are hosted by a luminous bulge-dominated galaxies, the spectroscopic observations of bright BL Lacs presently indicate that these objects are likely sources with extremely beamed nuclear emission. We present simulations to show under which circumstances it is possible to probe this hypothesis from the detection of very weak absorptions using the next generation of extremely large optical telescopes.
Key words: BL Lacertae objects: general / instrumentation: spectrographs / cosmology: observations
Figures 6–17 are available in electronic form at http://www.aanda.org
The full spectra are only available at the CDS via anonymous ftp to cdsarc.u-strasbg.fr (130.79.128.5) or via http://cdsarc.u-strasbg.fr/viz-bin/qcat?J/A+A/570/A126
© ESO, 2014
1. Introduction
BL Lac objects are active nuclei of massive elliptical galaxies characterized by a strong non-thermal emission that is dominated by a relativistic jet, which is closely aligned along the line of sight (see e.g. Falomo et al., in prep.). As a consequence, their optical spectra exhibit weak lines or a featureless continuum thus preventing the determination of their redshift. Nevertheless, the estimated distance of BL Lac objects is mandatory for constraining models of their emission, considering that these objects are also the dominant population of the extragalactic sky at high energies, especially for the TeV band (e.g. Costamante 2013). In the absence of direct redshift measurement through the nuclear emission lines or absorptions from host galaxies, other procedures have been proposed. Some are based on the measurement of the absolute magnitude of the host galaxy, which can be assumed as a standard candle (see Sbarufatti et al. 2005a, and references therein), while others exploit the detection of intervening absorption lines toward the source to set a lower limit to the redshift. For instance, this method was successfully exploited with HST/COS observations of Lyman-α forest in far-ultraviolet (FUV) constraining the redshift of a number of bright BL Lacs at z ~ 0.4 (see e.g. Danforth et al. 2010; Furniss et al. 2013). Another approach to obtain redshift lower limits of BLL is to use their spectral energy distribution over a very large spectral range (Rau et al. 2012).
The improved signal-to-noise ratio (S/N) of optical spectra collected through a new generation large telescopes, combined with high throughput instruments, has also been successfully adopted in the determination of redshifts of BL Lacs (e.g. Sbarufatti et al. 2006; Landoni et al. 2013; Shaw et al. 2013, and references therein). The campaigns carried out by Sbarufatti et al. (2006) and Landoni et al. (2013) at the 10mt class telescopes, VLT with FORS2 spectrograph, which improves the S/N of up to ~300 for bright sources allowed the determination of redshifts for many objects that had featureless spectra based on observations collected by 4mt class telescopes.
Journal of observations.
Redshift lower limits and properties of observed sources.
In this context, the new generation of spectrographs that combine high resolution and wide spectral coverage yield a considerable improvement on these issues. In this light, the state-of-the-art X-Shooter spectrograph at ESO-VLT is the most natural choice to tackle BL Lac spectroscopy. With this instrument, it is possible to detect very faint spectral features (EW ~ 1 order of magnitude smaller than those detectable with previous instruments). This translates into the possibility to infer a stringent lower limit to the redshift of the sources in which no spectral features (intrinsic or due to intervening systems) are present.
To exploit these new capabilities we obtained spectroscopy of five bright BL Lac objects (R ≤ 17), which had defeated previous redshift determinations. They are, therefore, expected to be extremely luminous in the optical band or extremely beamed. In this work we report the results for four sources since PKS 0048-097 was already discussed in Landoni et al. (2012).
The paper is organised as follows. Our observations and data reduction are detailed in Sect. 2 while main spectroscopical results are reported in Sect. 3. Discussion and conclusions on the overall sample with an outlook on future perspective are given in Sect. 4. Throughout the paper, we consider the following cosmological parameters H0 = 70 km s-1 Mpc-1, Ωm = 0.27 and ΩΛ = 0.73.
2. Observations, data reduction and analysis
We secured UVB (3200−5500 Å), VIS (5600−10 000 Å) and NIR (11 000−15 000 Å) spectra of the targets in service mode using the European Southern Observatory (ESO) Very Large Telescope (VLT) equipped with the X-Shooter spectrograph (Vernet et al. 2011). The instrument was configured in standard NODDING mode by adopting the recommended ABBA sequence for the exposures to guarantee an accurate sky subtraction in the extracted frames. The journal of observation is reported in Table 1.
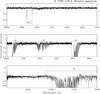 |
Fig. 1 H 1722+119 X-Shooter normalised spectrum in three sample ranges (first panel: UVB channel; middle panel: VIS channel; bottom panel: near-IR channel). With the exception of galactic and telluric features, no intrinsic or intervening spectral lines are detected in the full range of ~0.33−1.5 μm. |
Data reduction was performed by the X-Shooter data reduction pipeline (version 2.0.0, see Goldoni et al. 2006) in polynomial mode. In particular, we calculated the master bias frames and master flat frames for each channel for each observation. We also obtained the bidimensional mapping required by the pipeline stack to resample the echelle orders. Finally, we computed the sensitivity functions to calibrate the spectra in flux using spectrophotometric standard stars for each channel.
To consider slit loss effects and overall systematics on the flux calibration of the spectra, we performed a photometry on the acquisition images of the targets, that were secured in R band. The overall uncertainty on the flux (based on the estimation of the S/N inside the aperture considered for photometry) is Δm ~ 0.20, while the wavelength calibration is accurate within Δλ ~ 0.5 Å. Checking the weather conditions at Paranal, the targets have been observed under clear sky conditions with the exception of PG 1553+113 and, marginally, H 1722+119 due to thin clouds during the exposure. The acquisition images have been secured with clear sky.
From the calibrated spectra of each source, we first compute the minimum detectable equivalent width (EW) by following the procedure described in Sbarufatti et al. (2005b) and we search for spectral features with an EW greater than the minimum measurable one. In the case of absence of detectable features, we exploit the capability of the instrument to measure minimal EW in the range 4000−8000 Å in order to put stringent lower limit to sources, which exhibit totally featureless spectra. We evaluate the EWmin on the wavelength range 4000−8000 Å, since it corresponds to a redshift interval of about 0.01 ≤ z ≤ 1.00 for the most prominent absorption lines of the host galaxy. This choice appears reasonable because is challenging, even with medium – resolution spectroscopy with a reasonable S/N for 8mt class telescopes, the detection of the underling host galaxy if the object lies at redshift higher than z ≥ 1, while even higher redshifts are also ruled out by the absence of Ly-α forest in the UV part of the X-Shooter spectrum. The minimum EW on the spectra, the apparent magnitude of the nucleus and the redshift are related through the equation: 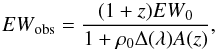 (1)where EWobs is the observed minimum equivalent width; EW0 is the equivalent width of the feature in the host galaxy template of Kinney et al. (1996); ρ0 is the nucleus-to-host flux ratio in the rest frame R band effective wavelength and A(z) is the aperture correction. The term Δ(λ) is a normalisation factor, which considers the redshift of the source. The knowledge of EWobs, which is the detectable minimum one, and the apparent magnitude of the nucleus allow us to apply Eq. (1) to derive a lower limit to the redshift. Details are given in Sbarufatti et al. (2006) and references therein. We applied this procedure to our four spectra, which are reported in the results of Table 2.
Finally, to take advantage of the available extended spectral range, we performed a synthetic narrow band photometry by integrating the flux density in various bins of 200 Å on the spectrum of each object aimed to construct the spectral energy distribution (SED).
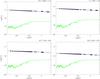 |
Fig. 2 SEDs of the four bright BL Lac object obtained from X-Shooter spectra in the wavelength range 3200−15 000 Å. The blue solid line is the sum of the two components: the non-thermal emission, which is described by a single power law (red dashed line), and the contribution from a luminous host galaxy starlight (Mr = −23.90) at z = 0.50 (green solid line). The superposition of the blue and red lines indicate that such a galaxy is hidden by the very bright nuclear emission. |
3. Results
We report an example of the spectra in three different ranges from optical to near-IR in Fig. 11. With the exception of MH 2136-428 where we are able to detect an intervening Ca II system at z ~ 0.008 (see section notes on individual sources), the other spectra do not show features apart from the galactic and telluric ones. The lower limit to the redshift for each source are also reported in Table 2.
In Fig. 2, we show the SEDs obtained with the procedure as described in Sect. 2. The observed emission is the sum of two components: a non-thermal power, which arises from the relativistic jet (single power law), and host galaxy starlight contribution at z ~ 0.5 from a luminous giant elliptical of Mr = −23.90, which is ~1 mag more luminous than a typical BL Lac host galaxy (giant elliptical of Mr = −22.90, Sbarufatti et al. 2005a). As illustrated in Fig. 2, the emission of each source is completely dominated by the non-thermal component and the starlight contribution from the galaxy, despite its luminosity, is negligible.
3.1. Notes on individual sources
PKS 1553+113: this very bright (R ~ 14) BL Lac source, which appeared in the Palomar-Green catalogue of ultraviolet-excess stellar objects (Green et al. 1986), has been thoroughly studied from the radio band to very high energy (VHE, we mention the recent availability of Cherenkov telescopes observations from e.g. Prandini et al. 2010 and Aleksić et al. 2012). In the near UV and optical bands (see e.g. Falomo & Treves 1990; Falomo et al. 1993), its spectrum appears to be featureless and dominated by the non-thermal emission. Spectroscopy with an 8 m class telescope at VLT (Sbarufatti et al. 2006) also confirmed a featureless nature of the spectrum and derived a lower limit for the source of z> 0.1 based on the lack of absorption features from the starlight component. The non-detection of a standard host galaxy in the HST images (Treves et al. 2007) allowed us to estimate z ≥ 0.30−0.40 making it one of the most distant TeV extragalactic source. These limits are consistent with two recent constraints on the redshift. The first is obtained through far UV spectroscopy with HST/COS (z ~ 0.40−0.50, see Danforth et al. 2010) and exploits the Lyman-α absorption systems toward the line of sight of the source, while the other is based on the observed absorption of the high energy TeV due to photon-photon interaction with the extragalactic background light, yielding z ≤ 0.60 (see Prandini et al. 2010). The X-Shooter spectroscopy presented in this paper confirms the featureless nature of the spectrum on the wide spectral range 3200−15 000 Å. Exploiting the capability to measure lines with a very small equivalent width we calculated a new redshift lower limit obtaining z ≥ 0.30.
H 1722+119: this source (R ~ 15) was studied by Allen et al. (1982) through spectrophotometry carried out with the 4 m class Anglo-Australian telescope in the 80’s confirming its bona-fide BL Lac nature (Allen et al. 1982). This object is also a well known strong radio (Healey et al. 2007), X-ray (Donato et al. 2005) and γ-ray emitter (see e.g. Abdo et al. 2010). The source has been recently discovered during a flare by MAGIC collaboration (Cortina 2013) in the TeV band. Previous spectroscopical study with 8 m class telescope (Sbarufatti et al. 2006) confirmed that H 1722+119 exhibits a completely featureless spectrum and put this object at z ≥ 0.17. We infer a tighter lower limit to the redshift of z> 0.35 from the minimum EWmin measured on the spectrum. We also remark that the source is unresolved in the image obtained with HST/WFPC3 (Urry et al. 2000).
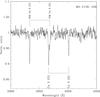 |
Fig. 3 MH 2136-428 Ca II intervening system arising in the nearby galaxy NGC 7097. |
MH 2136-428: this is a bright BL Lac object (R ~ 15), which was discovered through strong optical variability (Δm ~ 1.0) from the optical survey carried with the UK 1.2 Schmidt telescope (Hawkins et al. 1991). Spectroscopic studies (Hawkins et al. 1991; Sbarufatti et al. 2006; and Shaw et al. 2013) failed to detect intrinsic or intervening features. In our spectrum, there are no significant intrinsic emission or absorption lines down to EWmin = 0.06 that set a lower limit of the redshift z ≥ 0.50 (see Sect. 2). We note the presence of an intervening absorption system due to Ca II at λλ 3966.40 4001.20 (see Figs. 6−17 and 3), which corresponds to a radial velocity of 2450 ± 50 km s-1. We note that the H line is blended with the ISM Ca II K line. The EWs of the intervening absorption (obtained from deblending of the line for the H band) are EW = 0.15 ± 0.05Å and 0.10 ± 0.02Å. We searched for low redshift galaxies in the field of MH 2136-428 associated with the absorption. The most plausible object responsible for this absorption is the halo of the early type NGC 7097 (vr ~ 2400−2600 km s-1) at ~100 Kpc from the target (see Fig. 4). The target was observed by HST/ACS (Proposal ID: 9494, PI: Paolo Padovani) in a program for studying jet features in blazars. The unpublished image (see Fig. 4) shows the presence of a faint (mG1 ~ 21) spiral galaxy at ~3′′ northwest from the BL Lac. The faintness of G1 suggests that it is a background galaxy. We used the HST image to search for emission of host galaxy of the BL Lac. The analysis performed with AIDA (Uslenghi & Falomo 2011) shows that the target is unresolved, which is consistently with the relatively high redshift deduced from our spectroscopy.
PKS 2254-204: this object (R ~ 17) is a strongly polarised (Impey & Tapia 1990) featureless BL Lac (Véron-Cetty & Véron 2001). More recent high quality spectra confirm the featureless emission (see Sbarufatti et al. 2006). Our observation allows us to further search for very faint features (down to EW ~ 0.10Å) over a wider spectral range. In spite of this improvement, the spectrum remains lineless, which indicates a high nuclear-to-host galaxy emission. Based on this EWlim we set a redshift limit of z> 0.65.
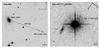 |
Fig. 4 BL Lac object MH 2136-428. Left panel: ESO/DSS field that shows the galaxy NGC 7097 that is possibly associated to the Ca II absorption system. Right panel: HST+ACS image (integration time is 780 s; f = F625W). The image clearly shows the presence of a faint galaxy at 3.2′′ NW from the BL Lac (labelled as G1). The target is unresolved and the faint galaxy (G1) at ~3.2′′ NW is likely a background object. |
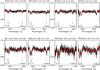 |
Fig. 5 Simulated spectra of four BL Lacs using E-ELT equipped with an X-Shooter-like instrument (texp = 3600 s, R ~ 3000). For each object, we report two cases at z = 0.50 on the left panel and z = 1.00 on the right panel. The red solid line is the smoothed spectrum obtained by the adoption of a boxcar filter (9 pixels). The spectra represent the maximum N/H flux ratio for which it is possible to detect Ca II and G band absorption lines of the host galaxy (see details in Table 2). |
4. Discussion and conclusions
We obtained high-quality spectra from near-UV to near-IR of a small sample of very bright BL Lac objects of unknown redshift. In spite of the significant improvement in terms of the S/N and spectral resolution of the new spectra with respect to previous data, we do not detect any intrinsic spectral feature arising from these sources. From the lack of starlight absorptions, we derived stringent lower limits to their redshift, which when combined with the brightness of the objects indicates that these BL Lacs have a very high nuclear to host ratio (see Table 2) compared to the average NHR values (0.1 to 1.0) as derived from Urry et al. (2000) and Scarpa et al. (2000). The extreme nucleus absolute magnitude and N/H ratio (in particular for PG 1553+113 and H 1722+119) may be ascribed to an intrinsic huge luminosity, to a major beaming, or to both effects combined. Assuming the presence of underlying broad emission lines, one can estimate an optical beaming factor δopt, which represents the ratio of the non-thermal (jet) to thermal component (disc) of the accreting nucleus. Following Landoni et al. (2013) and supposing a value for z ~ 0.40 such that Mg II (λ0 = 2800) is in the region of 4000−8000 Å, one can calculate the lower limit of δopt by adopting the minimum observable EWmin (see Table 2). Under this hypothesis, the presence of an extreme beaming is suggested according to values reported in Table 2.
Although the main result of the paper is to fix a lower limit to the z of the objects, one can put also upper limits by exploiting the incidence of Mg II absorption systems. Considering the distribution of those systems with EW ≥ 0.2 Å (Zhu & Ménard 2013), we evaluate that the expected number of system per source should to be ~0.8. In the spectra of our four sources we do not detect absorption systems of Mg II. Combining this fact with the TeV detection of 2 sources (PG 1553+113 and H 1722+119) we infer that the upper limit to the redshift should be z ≲ 0.50, in average.
E-ELT X-Shooter-like spectrograph simulation results.
The observations presented in this paper highlight the today capabilities to explore the spectroscopic properties of BL Lac objects and thus the determination of their redshift or tighter lower limits. To make a significant improvement in this field, a major contribution comes from the next generation of extremely large (30−50 m class) telescopes, such as the Thirty Meter Telescope2 and European Extremely Large Telescope (E-ELT)3. With these new facilities it will become possible to obtain a very high S/N spectra of bright BL Lacs and therefore detect the absorption features of their host galaxies under extreme conditions. To exemplify this point we performed simulations of the spectra of our targets as could be secured by an X-Shooter-like instrument (R ~ 3000) coupled to the E-ELT, which includes moderate adaptive optics facility. For the simulation, we assume a plate scale of 0.03′′ px-1 and a PSF with ~90% of encircled energy within an aperture of 3′′ to maximise the host galaxy flux inside the aperture. We estimated the S/N of each object using the AETC4 (Falomo et al. 2011). We produced simulated spectra of the targets, assuming z = 0.50 and z = 1.00, in order to evaluate the maximum nucleus to host galaxy flux ratio that allows one to detect the absorption lines of the galaxies (see Fig. 5). Result of the simulations are summarised in Table 3. With these future facilities, it turns out that it will be possible to derive the redshift of these objects under extreme conditions of observed N/H ratios from ~300 to ~2500 depending on redshift and target brightness. This corresponds to total N/H ratios in the range of 100−1700 that are 1−2 order of magnitude higher than the average found for resolved BL Lacs (Urry et al. 2000).
Online material
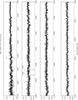 |
Fig. 6 PG 1553+113 X-Shooter normalized UVB spectrum. |
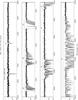 |
Fig. 7 PG 1553+113 X-Shooter normalized optical spectrum. |
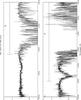 |
Fig. 8 PG 1553+113 X-Shooter normalized near-IR spectrum. |
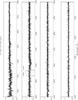 |
Fig. 9 H 1722+119 X-Shooter normalized UVB spectrum. |
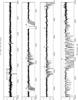 |
Fig. 10 H 1722+119 X-Shooter normalized optical spectrum. |
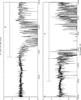 |
Fig. 11 H 1722+119 X-Shooter normalized near-IR spectrum. |
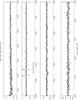 |
Fig. 12 MH 2136-428 X-Shooter normalized UVB spectrum. |
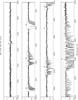 |
Fig. 13 MH 2136-428 X-Shooter normalized optical spectrum. |
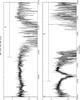 |
Fig. 14 MH 2136-428 X-Shooter normalized near-IR spectrum. |
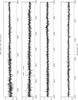 |
Fig. 15 PKS 2254-204 X-Shooter normalized UVB spectrum. |
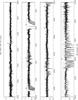 |
Fig. 16 PKS 2254-204 X-Shooter normalized optical spectrum. |
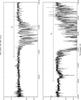 |
Fig. 17 PKS 2254-204 X-Shooter normalized near-IR spectrum. |
The full spectra for the four sources (Figs. 6–17) are available in both the electronic edition of the paper and on the website database http://archive.oapd.inaf.it/zbllac/
http://www.tmt.org
http://www.eso.org/sci/facilities/eelt/
References
- Abdo, A. A., Ackermann, M., Ajello, M., et al. 2010, ApJS, 188, 405 [NASA ADS] [CrossRef] [Google Scholar]
- Aleksić, J., Alvarez, E. A., Antonelli, L. A., et al. 2012, ApJ, 748, 46 [Google Scholar]
- Allen, D. A., Ward, M. J., & Hyland, A. R. 1982, MNRAS, 199, 969 [NASA ADS] [CrossRef] [Google Scholar]
- Cortina, J. 2013, ATel, 5080, 1 [NASA ADS] [Google Scholar]
- Costamante, L. 2013, Int. J. Mod. Phys. D, 22, 30025 [Google Scholar]
- Costamante, L., & Ghisellini, G. 2002, A&A, 384, 56 [NASA ADS] [CrossRef] [EDP Sciences] [Google Scholar]
- Danforth, C. W., Keeney, B. A., Stocke, J. T., Shull, J. M., & Yao, Y. 2010, ApJ, 720, 976 [NASA ADS] [CrossRef] [Google Scholar]
- Donato, D., Sambruna, R. M., & Gliozzi, M. 2005, A&A, 433, 1163 [NASA ADS] [CrossRef] [EDP Sciences] [Google Scholar]
- Falomo, R., & Treves, A. 1990, PASP, 102, 1120 [NASA ADS] [CrossRef] [Google Scholar]
- Falomo, R., Bersanelli, M., Bouchet, P., & Tanzi, E. G. 1993, AJ, 106, 11 [NASA ADS] [CrossRef] [Google Scholar]
- Falomo, R., Fantinel, D., & Uslenghi, M. 2011, in SPIE Conf. Ser., 8135 [Google Scholar]
- Furniss, A., Williams, D. A., Danforth, C., et al. 2013, ApJ, 768, L31 [NASA ADS] [CrossRef] [Google Scholar]
- Goldoni, P., Royer, F., François, P., et al. 2006, in SPIE Conf. Ser., 6269 [Google Scholar]
- Green, R. F., Schmidt, M., & Liebert, J. 1986, ApJS, 61, 305 [NASA ADS] [CrossRef] [Google Scholar]
- Hawkins, M. R. S., Veron, P., Hunstead, R. W., & Burgess, A. M. 1991, A&A, 248, 421 [NASA ADS] [Google Scholar]
- Healey, S. E., Romani, R. W., Taylor, G. B., et al. 2007, ApJS, 171, 61 [NASA ADS] [CrossRef] [Google Scholar]
- Impey, C. D., & Tapia, S. 1990, ApJ, 354, 124 [NASA ADS] [CrossRef] [Google Scholar]
- Landoni, M., Falomo, R., Treves, A., et al. 2012, A&A, 543, A116 [NASA ADS] [CrossRef] [EDP Sciences] [Google Scholar]
- Landoni, M., Falomo, R., Treves, A., et al. 2013, AJ, 145, 114 [NASA ADS] [CrossRef] [Google Scholar]
- Prandini, E., Bonnoli, G., Maraschi, L., Mariotti, M., & Tavecchio, F. 2010, MNRAS, 405, L76 [NASA ADS] [CrossRef] [Google Scholar]
- Rau, A., Schady, P., Greiner, J., et al. 2012, A&A, 538, A26 [NASA ADS] [CrossRef] [EDP Sciences] [Google Scholar]
- Sbarufatti, B., Treves, A., & Falomo, R. 2005a, ApJ, 635, 173 [NASA ADS] [CrossRef] [Google Scholar]
- Sbarufatti, B., Treves, A., Falomo, R., et al. 2005b, AJ, 129, 559 [NASA ADS] [CrossRef] [Google Scholar]
- Sbarufatti, B., Treves, A., Falomo, R., et al. 2006, AJ, 132, 1 [NASA ADS] [CrossRef] [Google Scholar]
- Scarpa, R., Urry, C. M., Falomo, R., Pesce, J. E., & Treves, A. 2000, ApJ, 532, 740 [NASA ADS] [CrossRef] [Google Scholar]
- Shaw, M. S., Romani, R. W., Cotter, G., et al. 2013, ApJ, 764, 135 [NASA ADS] [CrossRef] [Google Scholar]
- Treves, A., Falomo, R., & Uslenghi, M. 2007, A&A, 473, L17 [NASA ADS] [CrossRef] [EDP Sciences] [Google Scholar]
- Urry, C. M., Scarpa, R., O’Dowd, M., et al. 2000, ApJ, 532, 816 [NASA ADS] [CrossRef] [Google Scholar]
- Uslenghi, M., & Falomo, R. 2011, in SPIE Conf. Ser., 8135 [Google Scholar]
- Vernet, J., Dekker, H., D’Odorico, S., et al. 2011, A&A, 536, A105 [NASA ADS] [CrossRef] [EDP Sciences] [Google Scholar]
- Véron-Cetty, M.-P., & Véron, P. 2001, A&A, 374, 92 [NASA ADS] [CrossRef] [EDP Sciences] [Google Scholar]
- Zhu, G., & Ménard, B. 2013, ApJ, 770, 130 [NASA ADS] [CrossRef] [Google Scholar]
All Tables
All Figures
|
Fig. 1 H 1722+119 X-Shooter normalised spectrum in three sample ranges (first panel: UVB channel; middle panel: VIS channel; bottom panel: near-IR channel). With the exception of galactic and telluric features, no intrinsic or intervening spectral lines are detected in the full range of ~0.33−1.5 μm. |
| In the text | |
|
Fig. 2 SEDs of the four bright BL Lac object obtained from X-Shooter spectra in the wavelength range 3200−15 000 Å. The blue solid line is the sum of the two components: the non-thermal emission, which is described by a single power law (red dashed line), and the contribution from a luminous host galaxy starlight (Mr = −23.90) at z = 0.50 (green solid line). The superposition of the blue and red lines indicate that such a galaxy is hidden by the very bright nuclear emission. |
| In the text | |
|
Fig. 3 MH 2136-428 Ca II intervening system arising in the nearby galaxy NGC 7097. |
| In the text | |
|
Fig. 4 BL Lac object MH 2136-428. Left panel: ESO/DSS field that shows the galaxy NGC 7097 that is possibly associated to the Ca II absorption system. Right panel: HST+ACS image (integration time is 780 s; f = F625W). The image clearly shows the presence of a faint galaxy at 3.2′′ NW from the BL Lac (labelled as G1). The target is unresolved and the faint galaxy (G1) at ~3.2′′ NW is likely a background object. |
| In the text | |
|
Fig. 5 Simulated spectra of four BL Lacs using E-ELT equipped with an X-Shooter-like instrument (texp = 3600 s, R ~ 3000). For each object, we report two cases at z = 0.50 on the left panel and z = 1.00 on the right panel. The red solid line is the smoothed spectrum obtained by the adoption of a boxcar filter (9 pixels). The spectra represent the maximum N/H flux ratio for which it is possible to detect Ca II and G band absorption lines of the host galaxy (see details in Table 2). |
| In the text | |
|
Fig. 6 PG 1553+113 X-Shooter normalized UVB spectrum. |
| In the text | |
|
Fig. 7 PG 1553+113 X-Shooter normalized optical spectrum. |
| In the text | |
|
Fig. 8 PG 1553+113 X-Shooter normalized near-IR spectrum. |
| In the text | |
|
Fig. 9 H 1722+119 X-Shooter normalized UVB spectrum. |
| In the text | |
|
Fig. 10 H 1722+119 X-Shooter normalized optical spectrum. |
| In the text | |
|
Fig. 11 H 1722+119 X-Shooter normalized near-IR spectrum. |
| In the text | |
|
Fig. 12 MH 2136-428 X-Shooter normalized UVB spectrum. |
| In the text | |
|
Fig. 13 MH 2136-428 X-Shooter normalized optical spectrum. |
| In the text | |
|
Fig. 14 MH 2136-428 X-Shooter normalized near-IR spectrum. |
| In the text | |
|
Fig. 15 PKS 2254-204 X-Shooter normalized UVB spectrum. |
| In the text | |
|
Fig. 16 PKS 2254-204 X-Shooter normalized optical spectrum. |
| In the text | |
|
Fig. 17 PKS 2254-204 X-Shooter normalized near-IR spectrum. |
| In the text | |
Current usage metrics show cumulative count of Article Views (full-text article views including HTML views, PDF and ePub downloads, according to the available data) and Abstracts Views on Vision4Press platform.
Data correspond to usage on the plateform after 2015. The current usage metrics is available 48-96 hours after online publication and is updated daily on week days.
Initial download of the metrics may take a while.