Fig. 5
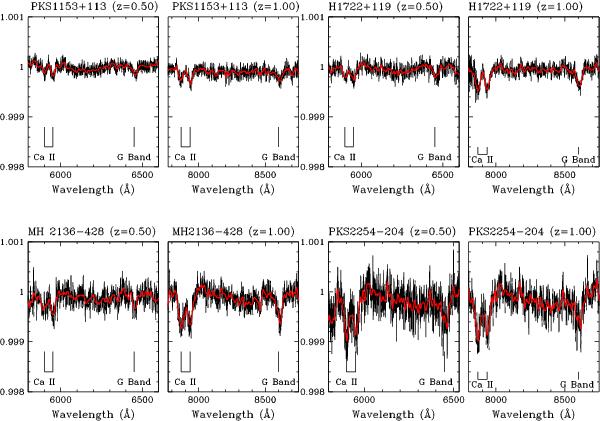
Simulated spectra of four BL Lacs using E-ELT equipped with an X-Shooter-like instrument (texp = 3600 s, R ~ 3000). For each object, we report two cases at z = 0.50 on the left panel and z = 1.00 on the right panel. The red solid line is the smoothed spectrum obtained by the adoption of a boxcar filter (9 pixels). The spectra represent the maximum N/H flux ratio for which it is possible to detect Ca II and G band absorption lines of the host galaxy (see details in Table 2).
Current usage metrics show cumulative count of Article Views (full-text article views including HTML views, PDF and ePub downloads, according to the available data) and Abstracts Views on Vision4Press platform.
Data correspond to usage on the plateform after 2015. The current usage metrics is available 48-96 hours after online publication and is updated daily on week days.
Initial download of the metrics may take a while.