Fig. 8
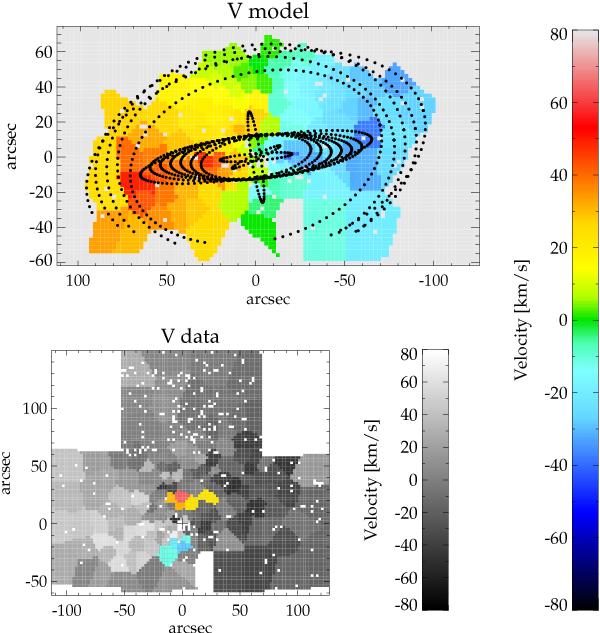
Upper panel: kinemetric model velocity map of the cleaned data cube. Black dots denote the best fitting ellipses. The model goes only to r ∼ 100′′ along the Galactic plane and to ∼60′′ perpendicular to it. The Voronoi bin with the highest uncertainty was excluded from the model. Lower panel: the velocity map as in Fig. 5 shown in grayscale, the bins that show rotation perpendicular to the Galactic plane are overplotted in colour scale.
Current usage metrics show cumulative count of Article Views (full-text article views including HTML views, PDF and ePub downloads, according to the available data) and Abstracts Views on Vision4Press platform.
Data correspond to usage on the plateform after 2015. The current usage metrics is available 48-96 hours after online publication and is updated daily on week days.
Initial download of the metrics may take a while.