Fig. 3
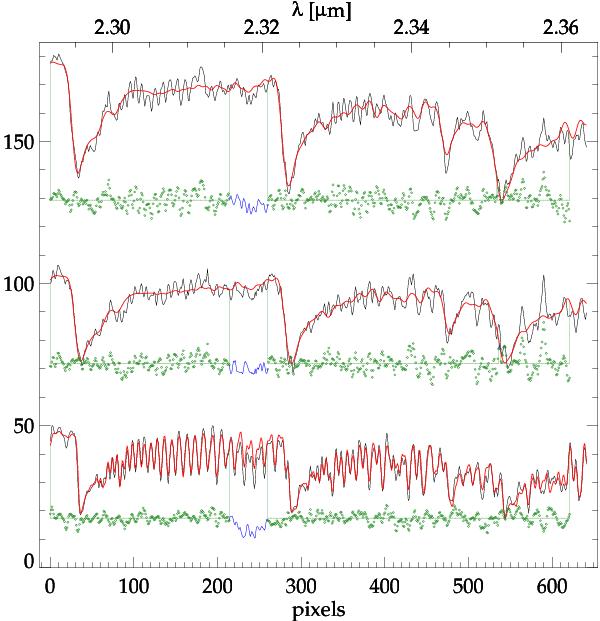
Example of CO absorption line spectra (black) of a Voronoi bin of the full data cube (upper spectrum), a Voronoi bin of the cleaned data cube (middle spectrum) and of a single star (lower spectrum). The red lines are the ppxf-fits to the data. The blue regions are not fitted, as there is a strong telluric absorption line in this wavelength region. Green dots are the residuals of the fits. The fluxes of the spectra are scaled for this plot.
Current usage metrics show cumulative count of Article Views (full-text article views including HTML views, PDF and ePub downloads, according to the available data) and Abstracts Views on Vision4Press platform.
Data correspond to usage on the plateform after 2015. The current usage metrics is available 48-96 hours after online publication and is updated daily on week days.
Initial download of the metrics may take a while.