Fig. 2
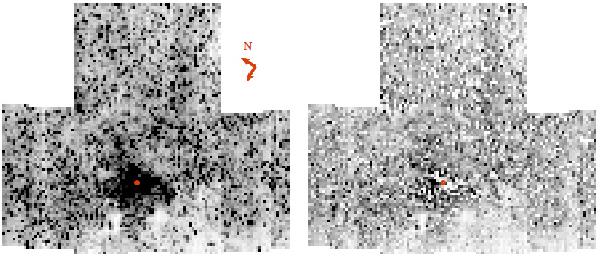
Reconstructed data cube from all central exposures, covering ∼240″ × 210″, flux summed over 2.29−2.365μm. The left panel uses all available data, i.e. the full data cube. The right panel is the data cube after removing foreground and background stars based on their colour, and stars brighter than K = 11.5m, i.e. the cleaned data cube. It contains only light from faint member stars. The red point denotes Sgr A*. The maps are oriented with the Galactic plane horizontally and Galactic north up and Galactic east left. The arrows indicate the orientation in the equatorial system. Both images are in the same linear flux scaling.
Current usage metrics show cumulative count of Article Views (full-text article views including HTML views, PDF and ePub downloads, according to the available data) and Abstracts Views on Vision4Press platform.
Data correspond to usage on the plateform after 2015. The current usage metrics is available 48-96 hours after online publication and is updated daily on week days.
Initial download of the metrics may take a while.