Fig. 15
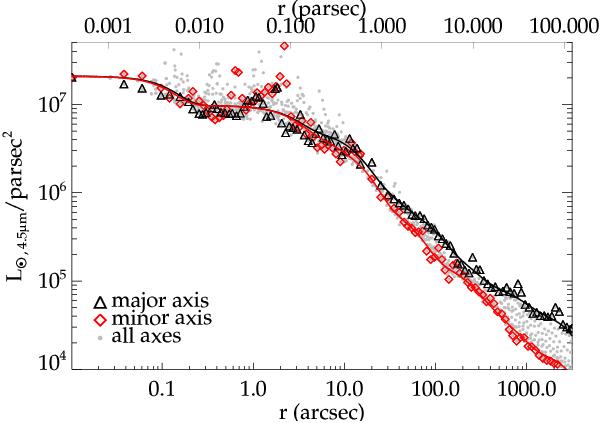
Surface brightness profile derived from a dust and extinction corrected Spitzer/IRAC 4.5 μm image and NACO K-band mosaic for the central 30′′. Black triangles denote measurements along the major axis, and red diamonds along the minor axis, the grey data points are all measurements, at all axes. The spikes in the profile are due to individual bright stars. Solid lines illustrate the Multi-Gaussian Expansion (MGE) fit to the data.
Current usage metrics show cumulative count of Article Views (full-text article views including HTML views, PDF and ePub downloads, according to the available data) and Abstracts Views on Vision4Press platform.
Data correspond to usage on the plateform after 2015. The current usage metrics is available 48-96 hours after online publication and is updated daily on week days.
Initial download of the metrics may take a while.