Fig. 13
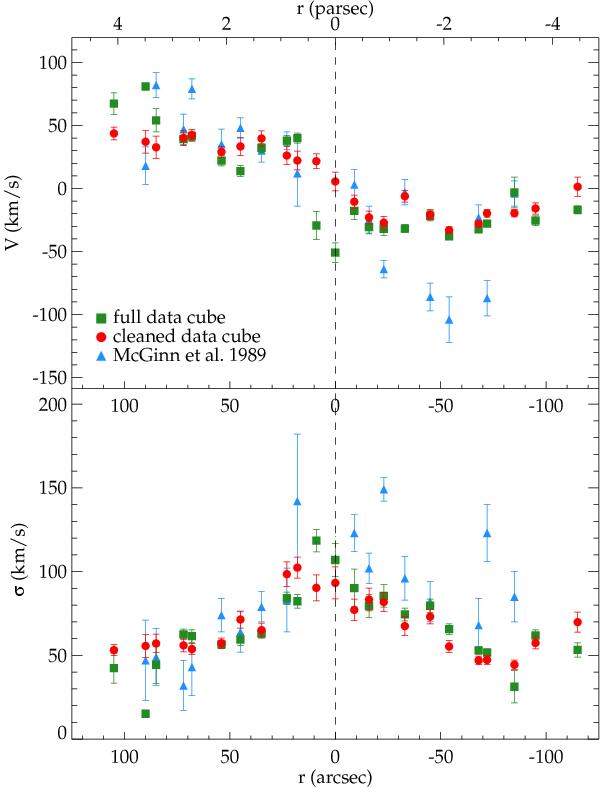
Velocity (upper panel) and velocity dispersion profile (lower panel) along the major axis, with IRS 16 as the centre. We applied the binning of McGinn et al. 1989 (blue), extended by five additional binning apertures. Results from our full ISAAC data cube are shown as green rectangles, red circles show the result from the cleaned data cube, and blue triangles denote the data from McGinn et al. (1989).
Current usage metrics show cumulative count of Article Views (full-text article views including HTML views, PDF and ePub downloads, according to the available data) and Abstracts Views on Vision4Press platform.
Data correspond to usage on the plateform after 2015. The current usage metrics is available 48-96 hours after online publication and is updated daily on week days.
Initial download of the metrics may take a while.