Fig. 12
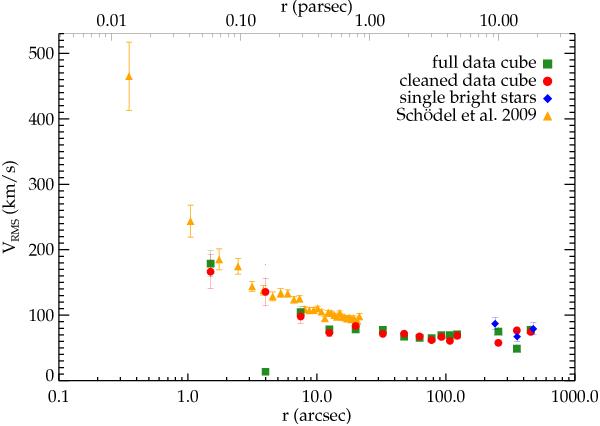
Velocity dispersion profile, obtained using circular bins around Sgr A*. The green rectangles are the data points from the full data cube, red circle points are from the cleaned data cube. The large discrepancy at r∼ 4′′ is due to the influence of the star IRS 7 on the green point. Blue diamonds are obtained from single bright stars in the outer fields. Orange triangles are proper motion data from Schödel et al. (2009).
Current usage metrics show cumulative count of Article Views (full-text article views including HTML views, PDF and ePub downloads, according to the available data) and Abstracts Views on Vision4Press platform.
Data correspond to usage on the plateform after 2015. The current usage metrics is available 48-96 hours after online publication and is updated daily on week days.
Initial download of the metrics may take a while.