Fig. 10
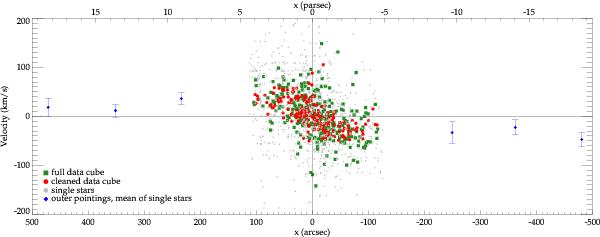
Position-velocity diagram along the Galactic plane for the velocity maps of Figs. 4 and 5. Results from our full ISAAC data cube are shown as green rectangles, red circles show the result from the cleaned data cube, which contains only faint cluster member stars. Grey dots denote velocity measurements from single stars, the blue diamonds are the mean velocities of the bright stars at the outer fields, corrected for perspective rotation.
Current usage metrics show cumulative count of Article Views (full-text article views including HTML views, PDF and ePub downloads, according to the available data) and Abstracts Views on Vision4Press platform.
Data correspond to usage on the plateform after 2015. The current usage metrics is available 48-96 hours after online publication and is updated daily on week days.
Initial download of the metrics may take a while.