| Issue |
A&A
Volume 569, September 2014
|
|
|---|---|---|
| Article Number | A80 | |
| Number of page(s) | 8 | |
| Section | Extragalactic astronomy | |
| DOI | https://doi.org/10.1051/0004-6361/201423746 | |
| Published online | 26 September 2014 | |
Dust composition and mass-loss return from the luminous blue variable R71 in the LMC
1
Leiden Observatory, Leiden University,
PO Box 9513,
2300 RA
Leiden,
The Netherlands
e-mail:
suklima@strw.leidenuniv.nl
2
Astronomical Institute “Anton Pannekoek”, University of
Amsterdam, PO Box
94249, 1090 GE
Amsterdam, The
Netherlands
3
Space Telescope Science Institute, 3700 San Martin Drive, Baltimore, MD
21218,
USA
4
SRON, Sorbonnelaan 2, 3584 CA
Utrecht, The
Netherlands
Received: 3 March 2014
Accepted: 29 July 2014
Context. We present an analysis of mid- and far-infrared (IR) spectrum and spectral energy distribution (SED) of the luminous blue variable (LBV) R71 in the Large Magellanic Cloud (LMC).
Aims. This work aims to understand the overall contribution of high-mass LBVs to the total dust-mass budget of the interstellar medium (ISM) of the LMC and compare this with the contribution from low-mass asymptotic giant branch (AGB) stars. As a case study, we analyze the SED of R71.
Methods. We compiled all the available photometric and spectroscopic observational fluxes from various telescopes for a wide wavelength range (0.36–250 μm). We determined the dust composition from the spectroscopic data, and derived the ejected dust mass, dust mass-loss rate, and other dust shell properties by modeling the SED of R71. We noted nine spectral features in the dust shell of R71 by analyzing Spitzer Space Telescope spectroscopic data. Among these, we identified three new crystalline silicate features. We computed our model spectrum by using 3D radiative transfer code MCMax.
Results. Our model calculation shows that dust is dominated by amorphous silicates, with some crystalline silicates, metallic iron, and a very tiny amount of polycyclic aromatic hydrocarbon (PAH) molecules. The presence of both silicates and PAHs indicates that the dust has a mixed chemistry. We derived a dust mass of 0.01 M⊙, from which we arrive at a total ejected mass of ≈5 M⊙. This implies a time-averaged dust mass-loss rate of 2.5 × 10⁻⁶ M⊙ yr-1 with an explosion about 4000 years ago. We assume that the other five confirmed dusty LBVs in the LMC loose mass at a similar rate, and estimate the total contribution to the mass budget of the LMC to be ≈10-5 M⊙ yr-1, which is comparable to the contribution by all the AGB stars in the LMC.
Conclusions. Based on our analysis on R71, we speculate that LBVs as a class may be an important dust source in the ISM of the LMC.
Key words: stars: atmospheres / stars: massive / stars: mass-loss / infrared: stars / radiative transfer / dust, extinction
© ESO, 2014
1. Introduction
Dust is a key component of the interstellar medium (ISM) of galaxies. Grains form primarily in the ejecta of the stars. The two main sources of dust are the winds of low-to intermediate-mass (M < 8 M⊙) stars and the rapidly evolving, high-mass stars (M> 8 M⊙). In our Milky Way Galaxy (MWG), low-mass stars mainly dominate the injection of dust into the ISM during the asymptotic giant branch (AGB) phase (Gehrz 1989). But the origin of dust in galaxies in the very early universe is controversial. The observed high abundance of dust in galaxies in the early Universe has often been taken to imply that rapidly evolving, high-mass stars are an important dust source, although studies have shown that low-mass AGB stars can evolve fast enough in low-metallicity environments (e.g., Vassiliadis & Wood 1993; Marigo 2000; Sloan et al. 2009) to contribute substantial amounts of dust.
The evolution of high-mass stars in galaxies is dominated by high mass-loss throughout their entire lives. Depending on the initial mass of the stars, their mass-loss rates vary during their evolution, and this in turn determines their final fates. The initial mass and mass-loss rate of a star determines whether it will end its life as a red supergiant (RSG) and explode as a supernovae (SNe), or evolve through a blue supergiant (BSG) to an unstable luminous blue variable (LBV) phase and subsequently move to the Wolf-Rayet (WR) phase before exploding as a SNe. Specifically, according to the stellar evolutionary scenario (e.g., Maeder 1983; Chiosi & Maeder 1986; Meynet et al. 2011), a star with an initial mass MZAMS ≥ 40 M⊙ undergoes the following evolutionary path:
 After a star has exhausted all of its hydrogen in its core, the core starts to shrink. This causes hydrogen-shell burning, which leads to a rapid redward evolution at more or less constant luminosity. But at some point the star becomes unstable, and mass loss increases dramatically. This phase of instability is known as the LBV phase. The LBVs show photometric variability ranging from giant eruptions of >2 mag to small oscillations of ≃0.1 mag (Lamers & Fitzpatrick 1988). These stars are intrinsically very bright with a luminosity of ≃106 L⊙ (Humphreys & Davidson 1984). Eventually, the star will strip off its outer hydrogen-rich layers and become a WR star with a helium-rich atmosphere.
For a star with initial mass between 30 M⊙ ≤ MZAMS ≤ 40 M⊙, the evolutionary path is almost the same, except that it can possibly (but not necessarily) go through an additional RSG phase:
 One of the fundamental question in astronomy is how much dust is contributed to the total mass budget of a galaxy by these high-mass stars (RSGs, LBVs, WRs, and SNe)? For the RSGs, it has been predicted that the stars with initial mass MZAMS> 30 M⊙ return approximately 3–10 M⊙ into the ISM (Jura & Kleinmann 1990). Even more mass can be ejected during the final SN explosion. Circumstellar dust around an LBV (η Car) was first discovered by Westphal & Neugebauer (1969) in the MWG. During this phase, the atmosphere is very loosely bound to the star and any small disturbance may lead to a high mass-loss rate typically between 10-6 <Ṁ < 10-4 M⊙ yr-1 (e.g., Stahl 1987; Lamers & Fitzpatrick 1988; Lamers 1997) with an expansion velocity (vexp) up to a few hundred km/s (Stahl & Wolf 1986). Over the average life-time of the LBVs (≃105 years), they may shed around 1 M⊙ or more through steady mass-loss and more during major eruptions (e.g., Humphreys & Davidson 1984; Stahl 1987; Nota & Lamers 1997). Similarly to the LBVs, the late-type WR stars (WC7 – WC9) lose mass at high rates of 10-5 <Ṁ < 10-4 M⊙ yr-1 (e.g., Williams et al. 1987; Crowther & Smith 1997), although in the MWG it has been estimated that late-type WC stars contribute only little to the dust-mass budget of the ISM (van der Hucht 1986).
It has long been assumed that most interstellar dust is injected into the ISM of galaxies by low-mass stars during the AGB phase. During this phase, these stars lose mass at a rate of 10-8 <Ṁ < 10-4 M⊙ yr-1 (vanLoon et al. 2005). Recently, it has become more and more apparent that high-mass stars play an important role in the dust budget of the ISM of galaxies. First, various authors (e.g., Omont et al. 2001; Bertoldi & Cox 2002; Maiolino 2006; Dwek et al. 2007; Gall et al. 2011) have speculated that high-mass stars may be an important source for the dust budget of the galaxies at high redshifts (as far back as 800 million years after the Big Bang). These authors have argued that at this early time, low-mass stars have not yet had the time to evolve into the AGB phase, although other studies have shown that low-mass AGB stars can evolve fast enough in low-metallicity environments to produce the dust seen in the galaxies at high redshifts (e.g., Vassiliadis & Wood 1993; Marigo 2000; Sloan et al. 2009).
Secondly, recent observations by Herschel Space Observatory (Pilbratt et al. 2010) have revealed ≃0.1 M⊙ of cold dust in the Galactic supernova remnant, Cas A, which corresponds to about 10% of the condensible elements (Barlow et al. 2010). Because this emission originates in the region interior to the reverse shock, it must correspond to dust condensed in the supernova ejecta. Similarly, a recent study has revealed that SN 1987A in the Large Magellanic Cloud (LMC) has produced ≃0.5 M⊙ of dust (Matsuura et al. 2011). Finally, various authors (e.g., Srinivasan et al. 2009; Matsuura et al. 2009; Riebel et al. 2012; Boyer et al. 2012) estimated the dust budget of the Magellanic Clouds. Their studies on the measured mass-injection rates by stars have focused almost exclusively on the AGB and RSG stars (e.g., Sargent et al. 2010, 2011; Riebel et al. 2012). Comparison of these dust-mass ejections with the far-infrared (IR) and submillimeter observations with the Herschel Space Observatory has revealed that the dust content of AGB stars falls short by an order of magnitude in explaining the observed dust content of the Magellanic Clouds. Hence, high-mass stars are likely a key source of interstellar dust in these galaxies, and it is very important for us to understand their contribution to the total dust-mass budget of the ISM of these galaxies.
To quantify the dust mass and the dust composition, we have choose to investigate the spectrum and spectral energy distribution (SED) of an LBV, R71 (HDE269006) in the LMC as a case study. We chose LMC because of its proximity (50 kpc; Scaefer 2008). In addition, studies of this kind are very difficult for the MWG because of confusion along the line-of-sight and distance ambiguity. One of the main motivations of this work is to complete the inventory of dust producers in the LMC. The AGB and RSG stars have been analyzed by various authors (e.g., Sargent et al. 2010, 2011; Riebel et al. 2012), but not the other massive stars. This article is the first attempt to thoroughly analyze of this prime target using all current data, including the new photometric fluxes from the Herschel Space Telescope.
R71 (MZAMS ≃ 40 M⊙; Lennon et al. 1993) is a very interesting LBV to study because it has been observed by various telescopes in a wide range of wavelengths, which provided spectroscopic data as well as photometric images. Various authors have studied either the spectral features (e.g., Voors et al. 1999; Morris et al. 2008; vanLoon et al. 2010; Waters 2010) or photometric images (e.g., Bonanos et al. 2009; Boyer et al. 2010) of R71 separately and determined dust properties for different wavelength regions. We have combined for the first time all the available photometric and spectroscopic data of R71 for a wide wavelength range (0.36–250 μm). This gives us an excellent opportunity to analyze the data to accurately determine the total dust mass and composition.
Voors et al. (1999) have used the 1D radiative transfer model MODUST to analyze the ISO CAM and SWS spectrum of R71. Since the ISO SWS spectrum between 30–45 μm was very noisy, their analysis was limited to the 6–28 μm wavelength range. These authors have identified the spectral PAH features at 6.2 and 7.7 μm and amorphous silicate feature at 10.0 μm and a crystalline silicate feature at 23.5 μm in the dust shell of R71. From the mid-IR spectrum of R71 they estimate a dust mass of 0.02 M⊙ and a time-averaged dust mass-loss rate of 7 × 10⁻⁶ M⊙ yr-1 over ≈3000 yr. But their model fails to reproduce the observation between 5–15 μm and also the 60 and 100 μm IRAS fluxes. By extrapolating the ISO SWS data, these authors speculated that R71 may have a second dust shell.
We have chosen to re-investigate the dust composition and dust mass of R71 because of the availability of Spitzer IRS spectroscopic data and the Herschel new photometric fluxes. Compared with Voors et al. (1999), we are able to combine all the available photometric and spectroscopic data of R71 over a wide wavelength range (0.36–250 μm; see Sect. 2). The better measurements of the far-IR photometric fluxes are important for an accurate dust-mass estimation. Combining the new data points provides a well-constrained model. The Spitzer IRS spectroscopic data of R71 have a much better S/N than the ISO SWS data that were used by Voors et al. (1999). Because of the excellent data quality, we have identified three new crystalline silicate (forsterite) features at 18.9, 27.5, and 33.6 μm, in addition to the 23.5 μm feature that was identified by Voors et al. (1999). Our identification of four crystalline spectral features firmly establishes the presence and importance of forsterite in the dust shell of R71 (see Sect. 3). Compared with Voors et al. (1999), we have used the more recent and sophisticated 3D radiative transfer model MCMax (Min et al. 2009) for our analysis. We are able to fit the observational data in general very well compared with Voors et al. (1999). Additionally, our analysis allows us to derive a first estimate for the overall contribution from the LBVs to the total dust-mass budget of the ISM of the LMC.
The organization of this paper is as follows: all the observational (photometric and spectroscopic) data are summarized in Sect. 2. In Sect. 3, we discuss the spectral dust features and possible potential mineral carriers of those features. We fit the entire SED of R71 using the 3D radiative transfer model MCMax. The results from our model calculation are shown in Sect. 4. Finally, Sect. 5 contains the discussion of our results, and in Sect. 6 we conclude our findings.
2. Observations
We obtained optical to far-IR photometric fluxes and spectroscopic data of R71 from various telescopes. All the observational data we used for our analysis are shown in Fig. 1. Optical U (0.36 μm), B (0.44 μm), V (0.55 μm), and I (0.97 μm) band photometric fluxes were obtained from the Magellanic Clouds Photometric Survey (MCPS; Zaritsky et al. 1997) and J (1.25 μm), H (1.65 μm), K (2.17 μm) fluxes from the Two Micron All-Sky Survey (2MASS; Skrutskie et al. 2006) through the Surveying The Agents of Galaxy Evolution Spitzer Legacy program (SAGE; Meixner et al. 2006) catalog. Similarly, we obtained Spitzer Space Telescope (Werner et al. 2004) InfraRed Array Camera (IRAC; Fazio et al. 2004) photometric fluxes at 3.6, 4.5, 5.8, and 8.0 μm from the SAGE catalog.
The mid-IR photometric fluxes at A (8.28 μm), C (12.13 μm), D (14.65 μm), E (21.3 μm) band were obtained from the Midcourse Space Experiment (MSX; Egan et al. 2001) survey images and source catalogs. For completeness, we included the mid-to far-IR photometric fluxes at 12.0, 25.0, and 60.0 μm from the InfraRed Astronomical Satelite (IRAS; Neugebauer et al. 1984) from the IRAS catalog (Beichman et al. 1988).
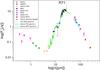 |
Fig. 1 All observation data of R71 obtained from various telescopes. |
We also obtained mid-to far-IR photometric fluxes from the Infrared Astronomical Satellite AKARI (Murakami et al. 2007) from the Infrared Camera (IRC) point source catalog (Kataza et al. 2009) at 9.0 and 18.0 μm and the Far-Infrared Surveyor (FIS) Bright Source catalog (Yamamura 2010) at 65.0, 90.0, and 140.0 μm. The far-IR photometric fluxes were obtained from the Spitzer Space Telescope Multiband Imaging Photometer (MIPS; Rieke et al. 2004) at 70 μm (at 24 μm, the flux is saturated) from the SAGE catalog (Meixner et al. 2006). Recently, the photometric fluxes from the Spitzer MIPS and Herschel Photodetector Array Camera and Spectrometer (PACS; Poglitsch et al. 2010) and from the Spectral and Photometric Imaging REceiver (SPIRE; Griffin et al. 2010) have been merged to improve both the quality of the data and the extraction process (e.g., Meixner et al. 2013; Seale et al. 2014). We obtained these new photometric merged fluxes at 100.0, 160.0, and 250.0 μm of R71. The fluxes at 350.0 and 500.0 μm are not detected by them. These new photometric fluxes better reflect both the flux and flux uncertainty of R71 compared with the Herschel PACS and SPIRE data, that were used by Boyer et al. (2010).
To analyze the spectral dust features of R71, we also obtained the spectroscopic data in the region of 5.2–38 μm from the Spitzer InfraRed Spectrograph (IRS; Houck et al. 2004) and the Spitzer MIPS spectrum in the region of 52–97 μm (SAGESpec; Kemper et al. 2010; van Loon et al. 2010). We also included mid-IR spectra from the Infrared Space Observatory (ISO; Kessler et al. 1996) Imaging Photo-Polarimeter (ISOPHOT; Lemke et al. 1996) for the region between 6–16 μm and from the Short Wavelength Spectrometer (SWS; de Graauw et al. 1996) for the region between 16–28 μm. The ISO data match the Spitzer data very well. The values of all the photometric fluxes (Fν) at different wavelengths from various instruments are listed in Table 1, along with σ values and corresponding references.
Observed photometric and spectroscopic fluxes at various wavelengths from various instruments.
3. Guided tour through the spectrum of R71
In this section, we mainly focus on the IR spectroscopic data of R71 to identify the spectral dust features and the potential dust mineral carrier of these features.
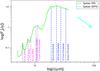 |
Fig. 2 Spitzer IRS and MIPS spectra of R71. We plot the nine spectral dust features (indicated by dashed straight lines), along with the potential dust minerals as carriers of these features. |
In Fig. 2, we present only the spectroscopic data of R71 obtained from Spitzer IRS and MIPS instruments (for references see Table 1). Because the ISO SWS spectrum matches the Spitzer IRS spectrum very well (see Sect. 2; Fig. 1), we did not include the ISO spectrum in Fig. 2.
We note nine spectral dust features in total at 6.2, 7.7, 8.6, 10.5, 11.3, 18.9, 23.5, 27.5, and 33.6 μm in the dust shell of R71. Evolved high-mass stars (with the exception of WR stars) are generally dominated by an oxygen-rich chemistry (C/O < 1), and therefore the condensation of carbon-rich (C/O > 1) dust species is not very obvious. R71 shows both silicates and carbonaceous material in its ejecta.
The Spitzer IRS spectrum of R71 shows clear evidence of spectral features at 6.2, 7.7, 8.6 (possibly), and 11.3 μm. These features were also identified by Voors et al. (1999) in the ISO SWS spectrum of R71 (also shown in Fig. 1, black dotted line), although the 3.3 μm PAH emission feature is not detected in the ISO SWS spectrum. These features are attributed to C-H and C-C stretching and bending modes in large (≈50 C-atom) polycyclic aromatic hydrocarbon (PAH) molecules (e.g., Allamandola et al. 1985; Leger & Puget 1985; Tielens 2008).
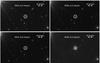 |
Fig. 3 Spitzer IRAC images at 3.6, 4.5, 5.8, and 8.0 μm of R71, which clearly show that the PAH features are associated with R71. R71 is a point source taken from the Spitzer SAGE catalog and is located inside the white circle; the radius of the circle is 10 arcsec. The extent in 8.0 μm image reflects the PSF size. |
We note that the 11.3 μm feature can also have a contribution from crystalline silicate (forsterite: Mg2SiO4; Molster et al. 2002a; Guha Niyogi et al. 2011). The PAH features indicate C-rich dust.
To clarify whether these PAH features are associated with R71 or emission from the background ISM, we obtained the photometric images from Spitzer IRAC at 3.6, 4.5, 5.8, and 8.0 μm. The images of R71 are shown in Fig. 3. R71 is a point source, and the extent shown in Fig. 3 reflects the point spread function (PSF) size. From IRAC 8.0 μm image it is very clear that the apparent shape is a typical bright Spitzer IRAC PSF for the LMC (FWHM = 3.6 arcsec; Meixner et al. 2006). From the photometric images, we are confident that these spectral features are associated with R71.
The Spitzer IRS spectrum reveals a broad feature between 8–12 μm. Within this broad feature, we identify a prominent amorphous silicate feature at 10.5 μm and a crystalline silicate/PAH feature at 11.3 μm (as already discussed above). This silicate feature indicates O-rich dust. This silicate feature was previously detected in many astrophysical environments, including the solar system and extra-solar planetary systems (Mann et al. 2006), the circumstellar regions of both young stellar objects, AGB stars, and planetary nebulae (e.g., Speck et al. 2000; Casassus et al. 2001); many lines of sight through the interstellar medium in our own galaxy (Chiar et al. 2007), and in nearby and distant galaxies (Hao et al. 2005).
The spectrum rises sharply at 12 μm and has a broad peak between 12–37 μm. Since the ISO SWS spectrum between 30–45 μm was very noisy, Voors et al. (1999) only identified one crystalline silicate feature at 23.5 μm. Because of the availability of high-quality Spitzer IRS spectrum of R71, we identified four crystalline silicate spectral features at 18.9, 23.5, 27.5, and 33.6 μm in the dust shell of R71 (see Figs. 2 and 4). These features are attributed to crystalline silicates: forsterite (Mg2SiO4). These features have also been identified before in various astrophysical objects (e.g., young stellar objects, AGB stars, post-AGB stars, planetary nebulae, high-mass stars) by various authors (e.g., Waters et al. 1996; Waelkens et al. 1996; Molster et al. 2002a; Guha Niyogi et al. 2011). The steep rise between 16 and 19.5 μm stems from the contribution of both the amorphous and crystalline silicates.
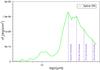 |
Fig. 4 Spitzer IRS spectrum of R71. These are the same data as Fig. 2, but here the y-axis is plotted in linear scale to emphasize the crystalline silicate (forsterite) features at 18.9, 23.5, 27.5, and 33.6 μm. |
That there are PAHs and silicates in the dust shell of R71 is no unique finding. The presence of PAHs in an O-rich environment have also been detected in the ISO SWS spectra of other Galactic LBVs, for example, AG Car (Voors et al. 2000) and HD 168625 (Skinner 1997), and in the planetary nebula (PN) NGC 6302 (Beintema 1998). Recently, mixed chemistry has also been detected in PNe toward the Galactic bulge by analyzing Spitzer IRS spectra (e.g., Gutenkunst et al. 2008; Guzman-Ramirez et al. 2011).
The origin of PAH emission in the dust shell of R71 is unclear. The presence of both the silicates and carbonaceous compounds suggests that there were perhaps two almost simultaneous mass-loss events associated with the shell: one that led to silicate condensation, and another that led to carbon dust. This is a common phenomenon for LBVs, but it does not necessarily imply O-rich and C-rich ejecta. Some O-rich ejecta also show the two dust types in their ejecta (e.g., Sylvester 1999). Alternatively, PAH formation reflects the condensation of carbonaceous compounds on iron-rich grains through Fischer-Tropsch-like reactions (e.g., Kress & Tielens 1996) and the subsequent release of these species into the gas phase.
Input and fit parameters of R71.
4. Dust model for R71
After identifying the spectral dust features and the dust composition in the dust shell of R71, the next step is to model the SED of R71.
We computed the model spectrum of R71 using the Monte Carlo radiative transfer code MCMax (Min et al. 2009). This code is based on a 3D Monte Carlo radiative transfer model (e.g., Bjorkman & Wood 2001; Niccolini et al. 2003; Pinte et al. 2006). In this method photon packages emerging from the central star are traced through the dust shell, allowing them to undergo scattering, absorption, and re-emission events caused by the dust they encounter on their path. For a detailed description of the MCMax code, we refer to Min et al. (2009). Our choice of using this code over others (e.g., DUSTY, 2-DUST) was made simply because it is accurate at all optical depths and sets virtually no restrictions on the spatial distribution of matter or on the optical properties of the dust grains. Last not least, it is a self-consistent method.
4.1. Stellar parameters
For our model calculation, we treated the LBV as a central star enclosed by a spherically symmetric dust shell. The central star was treated as a black body defined by its radius and temperature. We adopted a stellar temperature (Teff) = 17 000 K and luminosity (L⋆) = 7 × 10⁵ L⊙, stellar radius (R⋆) = 95 R⊙, and stellar mass (M⋆) = 20 M⊙. The values of these stellar parameters were taken from Lennon et al. (1993) and are listed in Table 2.
4.2. Dust-shell parameters
We assumed that the density distribution inside the dust shell is spherically symmetric and time independent with an r-2 radial dependence. We adopted a dust-to-gas ratio (fd/g) of 1/500 for the LMC, as applied by other authors (e.g., van Loon et al. 1999; Sargent et al. 2011) to calculate the mass-loss late of RSGs in the LMC. This value of fd/g is believed to be representative of the moderately low LMC metallicity.
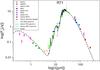 |
Fig. 5 Best-fit model of R71 along with all the observational data. The model fits very well over the entire wavelength region. Our model is shown as a black dashed curve. All the input and fitted parameters are listed in Table 2. |
The best-fit model along with all the observational data is shown in Fig. 5 for the entire wavelength region. The model fits the SED in general very well. From our best-fit models we derive that it requires a dust shell of inner radius (Rin) = 1.0 × 10⁴ AU, outer radius (Rout) = 6.0 × 10⁴ AU, and a total dust mass (Mdust) = 0.01 M⊙. These dust shell parameters are also listed in Table 2. From these results, we interpret that R71 has an optically thin dust shell. We note that the dust mass might be underestimated because there are dense, optically thick dust clumps. The far-IR fluxes will probably detect most of the dust and are not expected to vary significantly from our derived dust mass.
4.3. Dust composition
In Sect. 3, we have identified the spectral dust features in the dust shell of R71 and the potential mineral carriers for these features. For the dust composition, we used mixture of amorphous and crystalline silicates and PAHs. For the amorphous dust we used two types of amorphous silicates (MgSiO3 and MgFeSiO3), for crystalline silicate we used forsterite (Mg2SiO4). As a smooth continuum opacity we also included metallic iron (Kemper et al. 2002) in our model calculation. We used the optical constants (n,k; for reference see Table 2) of these minerals to calculate their absorption cross-section (Cabs). In Fig. 6 we show the spectroscopic data of R71 by Spitzer IRS and MIPS with our best-fit model.
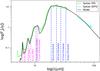 |
Fig. 6 Best-fit dust model plotted against the spectroscopic observational data of R71, obtained by Spitzer IRS and MIPS. In general, the model fits the PAHs and silicate features well. |
From our best-fit model we derived that the dust is mainly dominated by amorphous silicates: MgSiO3 (63%), and MgFeSiO3 (30%), and with some crystalline silicate: Mg2SiO4 (3%), metallic iron (3%), (3%) and a very tiny amount of PAHs (0.1%). The dust composition with their mass-abundances that we used in our model are listed in Table 2. From the SED, we calculated a ratio of the PAH emission to the total = 0.02, which in turns leads to a mass abundance (mPAH/mDust) of ≈0.05 (Tielens 2008). Depending on the formation mechanism of the PAHs in the O-rich environment, it is quite plausible that they have a much lower abundance than the bulk of the dust and the gas density.
From Fig. 6, we can see that in general our model fits the PAHs and silicate features much better than the model fit of Voors et al. (1999). The only discrepancy of the model with the observation is at around 7.0 and 12.0 μm. We suggest that the amorphous silicate profile (which was calculated from laboratory-measured optical constants; see Table 2) may not provide an entirely suitable representation of the actual interstellar and/or circumstellar silicate profile. In fact, the profile of interstellar/circumstellar silicates is only poorly determined in the 12.0 μm region (Chiar & Tielens 2006). We also note that Voors et al. (1999) were unable to model the 12–15 μm region and attributed this to a missing warm component in their model calculation. The LBV HD 168625 provides another example of a source with the same problem. It has been speculated that in this source the problem reflects transiently heated very small grains (O’Hara et al. 2003). We note that our overall good fit of the R71 spectrum argues against including other dust materials because they would contribute to the emission over a much broader wavelength region than the quite limited wavelength ranges where our model fails to provide a satisfactory fit.
4.4. Dust-grain size distribution
For both amorphous and crystalline silicates and metallic iron we used grain sizes between 0.01–0.1 μm, of grain size distribution (n(a) ∝ a−q, where q = 3.5) adopted from Mathis et al. (1977). The very low PAH emission in the dust shell of R71 indicates a population of very small grains that are probably not in thermal equilibrium. For PAHs, we used dust grain sizes of 0.001–0.0011 μm (i.e., 540 C-atoms). We tested models with grain-size distributions of 0.01–1.0 μm or 0.01–10.0 μm for silicate particles that required significantly different dust-masses of the shell, but still did not fit as well, as shown in Fig. 5. These dust size distributions are also listed in Table 2.
5. Discussion
Our derived Mdust = 0.01 M⊙ of R71 (see Sect. 4.2) is an order of magnitude lower than previously derived by Boyer et al. (2010) using Herschel PACS and SPIRE data. This is because these authors had taken into account the submm emission (at 350, 500 μm) in their analysis, but these photometric fluxes were later discarded because they were very weak (as discussed in Sect. 2; Meixner et al. 2013; Seale et al. 2014). Our derived Mdust for R71 has a similar order of magnitude as the previously derived Mdust of R71 by Voors et al. (1999), and also WRA 751 in MWG (Voors et al. 2000) obtained from an analysis of the ISO SWS spectrum. In the MWG, the two well-studied LBVs are AG Car and η Car. The dust mass injected by AG Car is ≃0.1 M⊙ (Voors et al. 2000) and that of η Car is ≃0.4 M⊙ (Gomez et al. 2010), which is an order of magnitude higher than the dust mass ejected by R71.
From the derived Mdust = 0.01 M⊙ and using fd/g = 1/500 for the LMC (see Sect. 4.2), we derived a total ejected mass (Mtotal) of ≈5 M⊙. This result agrees with the empirical “laws” by Stothers & Chin (1995). These authors have shown that the LBVs with luminosity log (L/L⊙) ≃ 5.7 (for R71, log (L/L⊙) = 5.85), have episodes of sudden mass loss of 4 ± 1 M⊙. Additionally, with the availability of far-IR photometric fluxes (see Fig. 1), we established that there is no second dust shell with a dust mass of 0.3 M⊙, as speculated by Voors et al. (1999).
The optical spectroscopic observational data of R71 revealed that the vexp of its circumstellar matter shows a complex behavior. From the literature, we found that the value of vexp varies between ≈10–130 km s-1 (e.g., Wolf et al. 1981; Stahl & Wolf 1986; Mehner et al. 2013). Here, we adopted the average value of ≈60 km s-1 (Wolf et al. 1981). From our derived dust-shell parameters (Rin,Rout,Mdust; see Sect. 4.2) and using the average expansion velocity of 60 km s-1, we derived the time-averaged dust mass-loss rate of 2.5 × 10⁻⁶ M⊙ yr-1 over ≈4000 years. This result falls into the range of 10-7 <Ṁ < 10-5 M⊙ yr-1 (at its minimum and maximum phase), as predicted by Wolf et al. (1981). Our derived mass-loss rate for R71 is on the same order of magnitude as derived for R71 and WRA 751 by Voors et al. (1999, 2000). η Car is well-known for its dramatic outbursts; its most famous mass ejection occurred in the early 19th century and is known as homunculus. Gomez et al. (2010) estimated the dust mass in the stellar wind to be 0.4 ± 0.1 M⊙, which translates into a mass loss greater than 40⊙ over the past 1000 years. It is clear, however that not all LBVs have dust mass-loss rates as high as η Car, and fewer than half of the objects have notable excesses (van Genderen 2001).
There are six confirmed dusty LBVs in the LMC, including R71 (Humphreys & Davidson 1994). Another five or six have been suggested as candidates in the literature (e.g., Weis 2003). To estimate the overall contribution from the LBVs to the total dust-mass budget of the ISM of the LMC, we assumed that their time-averaged dust mass-loss rate is approximately similar (≈2.5 × 10⁻⁶ M⊙ yr-1). The total mass-loss rate for six LBVs (including R71) is then ≈1.3 × 10⁻⁵ M⊙ yr-1. For the LMC, this is comparable to the mass-loss rate by all the AGBs and RSGs (≈10-5 M⊙ yr-1; Srinivasan et al. 2009; Matsuura et al. 2009; Tielens 2014). This rough estimation implies that LBVs as a class may be an important source of interstellar dust. Hence, a more detailed investigation of the total dust production by this class of stars and determination of their contribution to the dust budget of the LMC is a promising task.
6. Conclusions
We have analyzed the IR spectrum and SED of the LBV R71 in the LMC.
We conclude that:
-
1.
The SED of R71 shows that the short-wavelength region isdominated by the stellar emission, the long-wavelength regionby thermal emission of dust.
-
2.
R71 is enclosed by an optically thin dust shell. We adopted a density distribution that is spherically symmetric and time independent with an r-2 radial dependence.
-
3.
We note nine spectral dust features in total at 6.2, 7.7, 8.6, 10.5, 11.3, 18.9, 23.5, 27.5, and 33.6 μm from Spitzer IRS and MIPS spectra. Among them, we identified three new crystalline silicate features at 18.9, 27.5, and 33.6 μm.
-
4.
The chemistry of the dust shell is mainly dominated by amorphous silicates, with some crystalline silicates, metallic iron, and with a very tiny amount of PAHs.
-
5.
R71 shows both silicates and carbonaceous material in its ejecta. Possibly, two almost simultaneous mass-loss events associated with the shell created separate silicate and carbon dust condensations.
-
6.
We used the 3D radiative transfer code MCMax to compute the model spectrum. The model fits the overall SED and spectral features of R71 very well. From our model calculation, we derived dust shell parameters, dust composition, and dust mass.
-
7.
We derived Mtotal ≈ 5.0 M⊙ from the observed Mdust = 0.01 M⊙. This result agrees with predictions for similar types of LBVs as R71.
-
8.
From the dust-shell parameters, we derived a time-averaged dust mass-loss rate of 2.5 × 10⁻⁶ M⊙ yr-1. The mass-loss rate of R71 falls into the typical range of mass-loss rates of LBVs.
-
9.
From the derived mass-loss rate of R71, we extrapolated a mass-loss rate of 1.3 × 10⁻⁵ M⊙ yr-1 for six confirmed dusty LBVs (including R71) in the LMC, which is comparable to the mass-loss rate of all the AGBs and RSGs.
-
10.
A more detailed investigation of the total dust production by this class of stars and a determination of their contribution to the dust budget of the LMC is a promising task.
Acknowledgments
We are grateful to the referee, whose comments improved the quality of the article. We also thank Catharinus Dijkstra and Martha Boyer for their fruitful comments and feedback. Studies of interstellar dust and interstellar chemistry at Leiden Observatory are supported through advanced-ERC grant 246976 from the European Research Council, through a grant by the Dutch Science Agency, NWO, as part of the Dutch Astrochemistry Network, and through the Spinoza premie from the Dutch Science Agency, NWO.
References
- Allamandola, L. J., Tielens, A. G. G. M., & Barker, J. R. 1985, ApJ, 290, L25 [NASA ADS] [CrossRef] [Google Scholar]
- Barlow, M. J., Krause, O., Swinyard, B. M., et al. 2010, A&A, 518, 138 [Google Scholar]
- Beichman, C. A., Neugebauer, G., Habing, H. J., Clegg, P. E., & Chester, T. J. 1988, Infrared astronomical satellite (IRAS) catalogs and atlases. Volume 1: Explanatory supplement [Google Scholar]
- Beintema, D. A. 1998, Ap&SS, 255, 507 [Google Scholar]
- Bertoldi, F., & Cox, P. 2002, A&A, 384, L11 [NASA ADS] [CrossRef] [EDP Sciences] [Google Scholar]
- Bjorkman, J. E., & Wood, K. 2001, ApJ, 554, 615 [NASA ADS] [CrossRef] [Google Scholar]
- Bonanos, A. Z., Massa, D. L., Sewilo, M., et al. 2009, AJ, 138, 1003 [NASA ADS] [CrossRef] [Google Scholar]
- Bowey, J. E., Barlow, M. J., Molster, F. J., et al. 2002, MNRAS, 331, L1 [NASA ADS] [CrossRef] [Google Scholar]
- Boyer, M. L., Sargent, B., van Loon, J. Th., et al. 2010, A&A, 518, A142 [Google Scholar]
- Boyer, M. L., Srinivasan, S., Riebel, D., et al. 2012, ApJ, 748, 10 [NASA ADS] [CrossRef] [Google Scholar]
- Casassus, S., Roche, P. F., & Aitken, D. K. 2001, MNRAS, 320, 424 [NASA ADS] [CrossRef] [Google Scholar]
- Ceccarelli, C., Caux, E., Tielens, A. G. G. M., et al. 2002, A&A, 395, L29 [NASA ADS] [CrossRef] [EDP Sciences] [Google Scholar]
- Chiar, J. E., & Tielens, A. G. G. M. 2006, ApJ, 637, 774 [NASA ADS] [CrossRef] [Google Scholar]
- Chiar, J. E., Ennico, K., Pendleton, Y. J., et al. 2007, ApJ, 666, L73 [NASA ADS] [CrossRef] [Google Scholar]
- Chiosi, C., & Maeder, A. 1986, ARA&A, 24, 329 [NASA ADS] [CrossRef] [Google Scholar]
- Crowther, P. A., & Smith, L. J. 1997, A&A, 320, 500 [NASA ADS] [Google Scholar]
- de Graauw, T., Haser, L. N., Beintema, D. A., et al. 1996, A&A, 315, L49 [NASA ADS] [Google Scholar]
- de Vries, B. L., Blommaert, J. A. D. L., Waters, L. B. F. M., et al. 2013, A&A, 561, A14 [Google Scholar]
- Draine, B. T., & Li, A. 2007, ApJ, 657, 810 [NASA ADS] [CrossRef] [Google Scholar]
- Dwek, E., Galliano, F., & Jones, A. P. 2007, ApJ, 662, 927 [NASA ADS] [CrossRef] [Google Scholar]
- Egan, M. P., Van Dyk, S. D., & Price Stephan, D., 2001, AJ, 122, 1844 [NASA ADS] [CrossRef] [Google Scholar]
- Fazio, G. G., Hora, J. L., Allen, L. E., et al. 2004, ApJS, 154, 10 [NASA ADS] [CrossRef] [Google Scholar]
- Gall, C., Hjorth, J., & Andersen, A. C. 2011, A&ARv, 19, 43 [NASA ADS] [CrossRef] [Google Scholar]
- Gehrz, R. 1989, IAU Symp., 135, 445 [NASA ADS] [CrossRef] [Google Scholar]
- Gomez, H. L., Vlahakis, C., Stretch, C. M., et al. 2010, MNRAS, 401, L48 [NASA ADS] [CrossRef] [Google Scholar]
- Griffin, M. J., Abergel, A., Abreu, A., et al. 2010, A&A, 518, A3 [NASA ADS] [CrossRef] [EDP Sciences] [Google Scholar]
- Guha Niyogi, S., Speck, A. K., & Onaka, T. 2011, ApJ, 733, 93 [NASA ADS] [CrossRef] [Google Scholar]
- Gutenkunst, S., Bernard-Salas, J., Pottasch, S. R., et al. 2008, ApJ, 680, 1206 [NASA ADS] [CrossRef] [Google Scholar]
- Guzman-Ramirez, L., Zijlstra, A. A., Nchuimn, R., et al. 2011, MNRAS, 414, 1667 [NASA ADS] [CrossRef] [Google Scholar]
- Hao, L., Spoon, H. W. W., Sloan, G. C., et al. 2005, ApJ, 625, 75 [Google Scholar]
- Hillier, D. J., Davidson, K., Ishibashi, K., et al. 2001, ApJ, 553, 837 [NASA ADS] [CrossRef] [Google Scholar]
- Houck, J. R., Roellig, T. L., van Cleve, J., et al. 2004, ApJS, 154, 18 [NASA ADS] [CrossRef] [Google Scholar]
- Humphreys, R. M., & Davidson, K. 1984, Science, 223, 243 [NASA ADS] [CrossRef] [Google Scholar]
- Humphreys, R. M., & Davidson, K. 1994, PASP, 106, 1025 [NASA ADS] [CrossRef] [Google Scholar]
- Jäeger, C., Mutschke, H., Begemann, et al. 1994, A&A, 292, 641 [NASA ADS] [Google Scholar]
- Jura, M., & Kleinmann, S. G. 1990, ApJS, 73, 769 [NASA ADS] [CrossRef] [Google Scholar]
- Kataza, H., Sakon, I., & Spica Pre-project Team 2009, Mid Infrared Spectrometer onboard SPICA, 1003 [Google Scholar]
- Kemper, F., de Koter, A., Waters, L. B. F. M., et al. 2002, A&A, 384, 585 [NASA ADS] [CrossRef] [EDP Sciences] [Google Scholar]
- Kemper, F., Woods, Paul, M., Antoniou, V., et al. 2010, PASP, 122, 683 [NASA ADS] [CrossRef] [Google Scholar]
- Kessler, M. F., Steinz, J. A., Anderegg, M. E., et al. 1996, A&A, 315, 27 [Google Scholar]
- Kress, M. E., & Tielens, A. G. G. M. 1996, NASCP Scientific conference: From stardust to planetesimals, 149 [Google Scholar]
- Leger, A., & Puget, J. L. 1985, A&A, 137, L5 [Google Scholar]
- Lamers, H. J. G. L. M. 1997, ASPC Conf. Ser., 120, 76 [Google Scholar]
- Lamers, H. J. G. L. M., & Fitzpatrick, E. L. 1988, ApJ, 324, 279 [NASA ADS] [CrossRef] [Google Scholar]
- Lemke, D., Klaas, U., Abolins, J., et al. 1996, A&A, 315, L64 [NASA ADS] [Google Scholar]
- Lennon, D. J., Wobig, D., Kudritzki, R.-P., et al. 1993, Space Sci. Rev., 66, 207 [NASA ADS] [CrossRef] [Google Scholar]
- Maeder, A. 1983, A&A, 120, 113 [NASA ADS] [Google Scholar]
- Maiolino, R. 2006, 26th meeting of IAU Joint Discussion [Google Scholar]
- Mann, I., Köhler, M., Kimura, H., et al. 2006, AJ, 13, 159 [Google Scholar]
- Marigo, P. 2000, A&A, 360, 617 [NASA ADS] [Google Scholar]
- Mathis, J. S., Rumpl, W., & Nordsieck, K. H. 1977, ApJ 217, 425 [NASA ADS] [CrossRef] [Google Scholar]
- Matsuura, M., Barlow, M. J., Zijlstra, A. A., et al. 2009, MNRAS, 396, 918 [NASA ADS] [CrossRef] [Google Scholar]
- Matsuura, M., Dwek, E., Meixner, M., et al. 2011, Science, 333, 1258 [NASA ADS] [CrossRef] [Google Scholar]
- Mehner, A., Baade, D., Rivinius, T., et al. 2013, A&A, 555, A116 [NASA ADS] [CrossRef] [EDP Sciences] [Google Scholar]
- Meixner, M., Gordon, K. D., Indebetouw, R., et al. 2006, AJ, 132, 2268 [NASA ADS] [CrossRef] [Google Scholar]
- Meixner, M., Galliano, F., Hony, S., et al. 2010, A&A, 518, L71 [NASA ADS] [CrossRef] [EDP Sciences] [Google Scholar]
- Meixner, M., Panuzzo, P., Roman-Duval, J., et al. 2013, AJ, 146, 62 [NASA ADS] [CrossRef] [Google Scholar]
- Meynet, G., Georgy, C., Hirschi, R., et al. 2011, BSRSL, 80, 266 [Google Scholar]
- Molster, F. J., Waters, L. B. F. M., & Tielens, A. G. G. M. 2002, A&A, 382, 222 [NASA ADS] [CrossRef] [EDP Sciences] [Google Scholar]
- Molster, F. J., Waters, L. B. F. M., Tielens, A. G. G. M., et al. 2002, A&A, 382, 241 [NASA ADS] [CrossRef] [EDP Sciences] [Google Scholar]
- Morris, P., & Spitzer WRRINGS Team 2008, IAU Symp., 250, 361 [NASA ADS] [Google Scholar]
- Min, M., Dullemond, C. P., Dominik, C., et al. 2009, A&A, 497, 155 [NASA ADS] [CrossRef] [EDP Sciences] [Google Scholar]
- Murakami, H., Baba, H., Barthel, P., et al. 2007, PASJ, 59, S369 [NASA ADS] [CrossRef] [MathSciNet] [Google Scholar]
- Neugebauer, G., Habing, H. J., van Duinen, R., et al. 1984, ApJ, 278, L1 [Google Scholar]
- Niccolini, G., Woitke, P., & Lopez, B. 2003, A&A, 399, 703 [NASA ADS] [CrossRef] [EDP Sciences] [Google Scholar]
- Nota, A., & Lamers, H. 1997, Luminous Blue Variables: massive stars in transition, ASP Conf Ser., 120 [Google Scholar]
- O’Hara, T. B., Meixner, M., Speck, A. K., et al. 2003, ApJ, 598, 1255 [NASA ADS] [CrossRef] [Google Scholar]
- Omont, A., Cox, P., Bertoldi, F., et al. 2001, A&A, 374, 371 [NASA ADS] [CrossRef] [EDP Sciences] [Google Scholar]
- Pilbratt, G. L., Riedinger, J. L., PASSVOGEL, T., et al. 2010, A&A, 518, A1 [NASA ADS] [CrossRef] [EDP Sciences] [Google Scholar]
- Pinte, C., Mnard, F., Duchêne, G., et al. 2006, A&A, 459, 797 [NASA ADS] [CrossRef] [EDP Sciences] [Google Scholar]
- Poglitsch, A., Waelkens, C., Geis, N., et al. 2010, A&A, 518, A2 [Google Scholar]
- Pollack, J. B., Hollenbach, D., Beckwith, S., et al. 1994, ApJ, 421, 615 [NASA ADS] [CrossRef] [Google Scholar]
- Riebel, D., Srinivasan, S., Sargent, B., & Meixner, M. 2012, ApJ, 753, 18 [Google Scholar]
- Rieke, G. H., Young, E. T., Engelbracht, C. W., et al. 2004, ApJS, 154, 25 [NASA ADS] [CrossRef] [Google Scholar]
- Sargent, Benjamin, A., Srinivasan, S., Meixner, M., et al. 2010, ApJ, 716, 878 [NASA ADS] [CrossRef] [Google Scholar]
- Sargent Benjamin, A., Srinivasan, S., & Meixner, M. 2011, ApJ, 728, 93 [NASA ADS] [CrossRef] [Google Scholar]
- Schaefer, B. E. 2008, AJ, 135, 112 [NASA ADS] [CrossRef] [Google Scholar]
- Seale, J., Meixner, M., Sewilo, M., et al. 2014, ApJ, submitted [Google Scholar]
- Skinner, C. J. 1997, ASPC Conf. Ser., 120, 322 [Google Scholar]
- Skrutskie, M. F., Cutri, R. M., Stiening, R., et al. 2006, AJ, 131, 1163 [NASA ADS] [CrossRef] [Google Scholar]
- Sloan, G. C., Matsuura, M., Zijlstra, A. A., et al. 2009, Science, 323, 353 [NASA ADS] [CrossRef] [PubMed] [Google Scholar]
- Speck, A. K., Barlow, M. J., Sylvester, R. J., et al. 2000, A&A, 146, 437 [Google Scholar]
- Srinivasan, S., Meixner, M., Leitherer, C., et al. 2009, AJ, 137, 4810 [NASA ADS] [CrossRef] [Google Scholar]
- Stahl, O. 1987, A&A, 182, 229 [NASA ADS] [Google Scholar]
- Stahl, O., & Wolf, B. 1986, A&A, 158, 371 [NASA ADS] [Google Scholar]
- Stothers, R. B., & Chin, Chao-Wen 1995, ApJ, 451, 61 [Google Scholar]
- Sturm, B., Bouwman, J., Henning, Th., et al. 2013, ApJ, 553, 25 [Google Scholar]
- Sylvester, R. J. 1999, MNRAS, 309, 180 [NASA ADS] [CrossRef] [Google Scholar]
- Tielens, A. G. G. M. 2005, The Physics and Chemistry of the Interstellar Medium (Cambridge: Cambridge University Press) [Google Scholar]
- Tielens, A. G. G. M. 2008, ARA&A, 46, 289 [NASA ADS] [CrossRef] [EDP Sciences] [Google Scholar]
- Tielens, A. G. G. M. 2014, Proc. IAU Symp., SPICA Sci. Conf. 2013 [Google Scholar]
- van der Hucht, K. A., Cassinelli, J. P., & Williams, P. M. 1986, A&A, 168, 111 [NASA ADS] [Google Scholar]
- van Genderen, A. M. 2001, A&A, 366, 508 [NASA ADS] [CrossRef] [EDP Sciences] [Google Scholar]
- van Loon, J. Th., Groenewegen, M. A. T., de Koter, A., et al. 1999, A&A, 351, 559 [NASA ADS] [Google Scholar]
- van Loon, J. Th., Cioni, M.-R. L., Zijlstra, A. A., Loup, C., et al. 2005, A&A, 438, 273 [NASA ADS] [CrossRef] [EDP Sciences] [Google Scholar]
- van Loon, J. Th., Oliveira, J. M., Gordon, K. D., et al. 2010, AJ, 139, 68 [NASA ADS] [CrossRef] [Google Scholar]
- Vassiliadis, E., & Wood, P. R. 1993, ApJ, 413, 641 [NASA ADS] [CrossRef] [Google Scholar]
- Voors, R. H. M., Waters, L. B. F. M., Morris, P., et al. 1999, A&A, 341, L67 [NASA ADS] [Google Scholar]
- Voors, R. H. M., Waters, L. B. F. M., de Koter, A., et al. 2000, A&A, 356, 501 [NASA ADS] [Google Scholar]
- Waelkens, C., Waters, L. B. F. M., de Graauw, M. S., et al. 1996, A&A, 315, 245 [NASA ADS] [Google Scholar]
- Waters, L. B. F. M. 2010, ASPC, 425, 267 [NASA ADS] [Google Scholar]
- Waters, L. B. F. M., Molster, F. J., de Jong, T., et al. 1996, A&A, 315, 361 [Google Scholar]
- Weis, K. 2003, A&A, 408, 205 [NASA ADS] [CrossRef] [EDP Sciences] [Google Scholar]
- Werner, M. W., Roellig, T. L., Low, F. J., et al. 2004, ApJS, 154, 1 [Google Scholar]
- Westphal, J. A., & Neubebauer, G. 1969, ApJ, 156, 45 [Google Scholar]
- Williams, P. M., van der Hucht, K. A., & The, P. S. 1987, A&A, 182, 91 [NASA ADS] [Google Scholar]
- Wolf, B., Appenzeller, I., & Stahl, O. 1981, A&A, 103, 94 [NASA ADS] [Google Scholar]
- Yamamura, I. 2010, The AKARI Far-Infrared Bright Source Catalogue, COSPAR Meeting, 38, 2496 [NASA ADS] [Google Scholar]
- Zaritsky, D., Harris, J., & Thompson, I. 1997, AJ, 114, 1002 [NASA ADS] [CrossRef] [Google Scholar]
All Tables
Observed photometric and spectroscopic fluxes at various wavelengths from various instruments.
All Figures
|
Fig. 1 All observation data of R71 obtained from various telescopes. |
| In the text | |
|
Fig. 2 Spitzer IRS and MIPS spectra of R71. We plot the nine spectral dust features (indicated by dashed straight lines), along with the potential dust minerals as carriers of these features. |
| In the text | |
|
Fig. 3 Spitzer IRAC images at 3.6, 4.5, 5.8, and 8.0 μm of R71, which clearly show that the PAH features are associated with R71. R71 is a point source taken from the Spitzer SAGE catalog and is located inside the white circle; the radius of the circle is 10 arcsec. The extent in 8.0 μm image reflects the PSF size. |
| In the text | |
|
Fig. 4 Spitzer IRS spectrum of R71. These are the same data as Fig. 2, but here the y-axis is plotted in linear scale to emphasize the crystalline silicate (forsterite) features at 18.9, 23.5, 27.5, and 33.6 μm. |
| In the text | |
|
Fig. 5 Best-fit model of R71 along with all the observational data. The model fits very well over the entire wavelength region. Our model is shown as a black dashed curve. All the input and fitted parameters are listed in Table 2. |
| In the text | |
|
Fig. 6 Best-fit dust model plotted against the spectroscopic observational data of R71, obtained by Spitzer IRS and MIPS. In general, the model fits the PAHs and silicate features well. |
| In the text | |
Current usage metrics show cumulative count of Article Views (full-text article views including HTML views, PDF and ePub downloads, according to the available data) and Abstracts Views on Vision4Press platform.
Data correspond to usage on the plateform after 2015. The current usage metrics is available 48-96 hours after online publication and is updated daily on week days.
Initial download of the metrics may take a while.