Free Access
Fig. 5
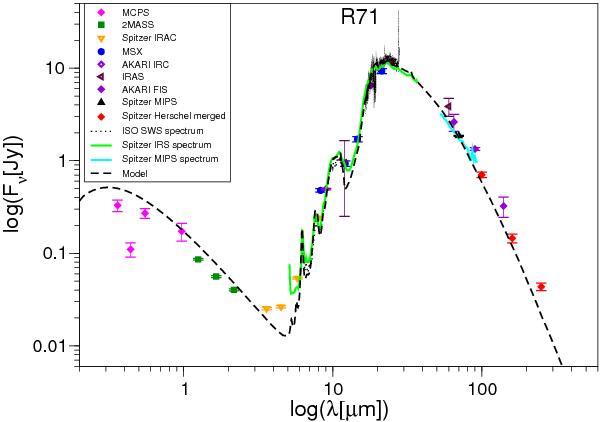
Best-fit model of R71 along with all the observational data. The model fits very well over the entire wavelength region. Our model is shown as a black dashed curve. All the input and fitted parameters are listed in Table 2.
Current usage metrics show cumulative count of Article Views (full-text article views including HTML views, PDF and ePub downloads, according to the available data) and Abstracts Views on Vision4Press platform.
Data correspond to usage on the plateform after 2015. The current usage metrics is available 48-96 hours after online publication and is updated daily on week days.
Initial download of the metrics may take a while.