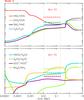
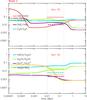
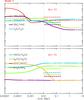
Fig. 7
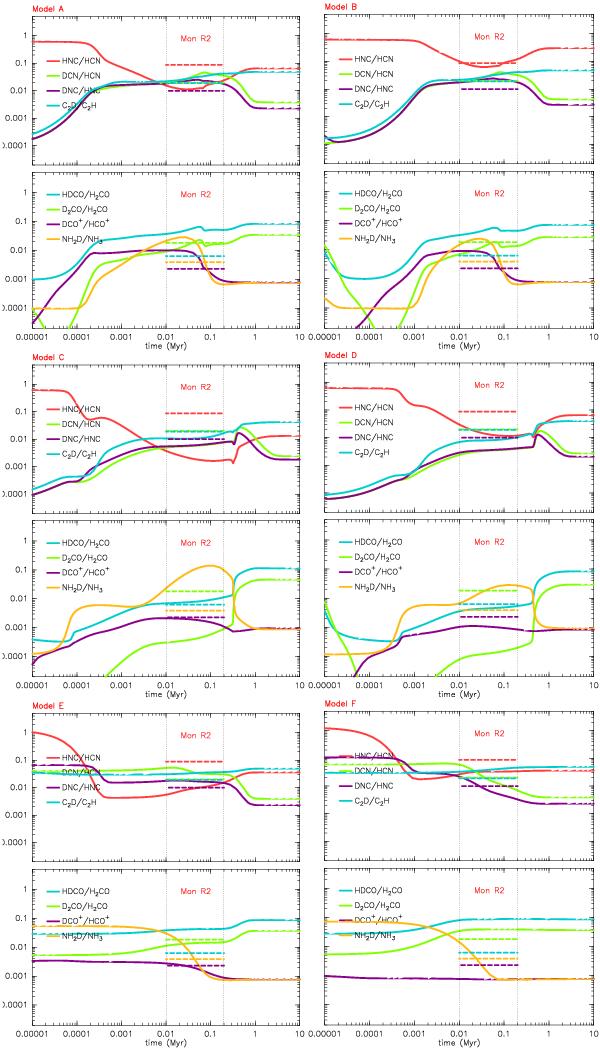
Chemical models considering a gas kinetic temperature of Tk = 50 K and OPR = 1 × 10⁻² (from model A to model D). Models E and F consider a temperature Tk = 50 K, but their initial abundances are obtained using another model (with Tk = 15 K and OPR = 1 × 10⁻⁴) at a time of 105 yr (for model E) and 106 yr (for model F). At the top part of the figures of every model, the red line represents the [HNC]/[HCN] ratio, the green represents the [DCN]/[HCN] ratio, the purple line shows the [DNC]/[HNC] ratio, and the blue line shows the [C2D]/[C2H] ratio. In the bottom part of the figures of every model, the blue line represents the [HDCO]/[H2CO] ratio, the green line shows the [D2CO]/[H2CO] ratio, the purple line shows the [DCO+]/[HCO+] ratio, and the yellow one shows the [NH2D]/[NH3] ratio. The dashed lines shows the ratios of observational results toward MonR2 for the 10.5 km s-1 component at the IF position.
Current usage metrics show cumulative count of Article Views (full-text article views including HTML views, PDF and ePub downloads, according to the available data) and Abstracts Views on Vision4Press platform.
Data correspond to usage on the plateform after 2015. The current usage metrics is available 48-96 hours after online publication and is updated daily on week days.
Initial download of the metrics may take a while.