Fig. 5
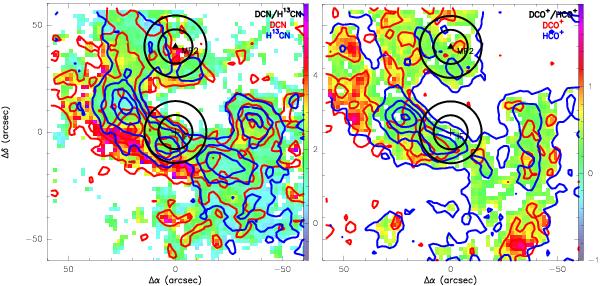
Left: the color scale shows the [DCN]/[HCN] ratio, the red contours mark the DCN emission at 216.112 GHz, the blue contours the H13CN emission at 259.011 GHz. Right: the color scale shows the [DCO+]/[HCO+] ratio, the red contours mark the DCO+ emission at 144.07728 GHz, the blue contours the H13CO+ emission at 260.255 GHz. The contour levels are 5σ, 10σ, 15σ, 20σ, and 25σ. The black circles represent the 2 and 3 mm beams.
Current usage metrics show cumulative count of Article Views (full-text article views including HTML views, PDF and ePub downloads, according to the available data) and Abstracts Views on Vision4Press platform.
Data correspond to usage on the plateform after 2015. The current usage metrics is available 48-96 hours after online publication and is updated daily on week days.
Initial download of the metrics may take a while.