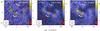
Fig. 3
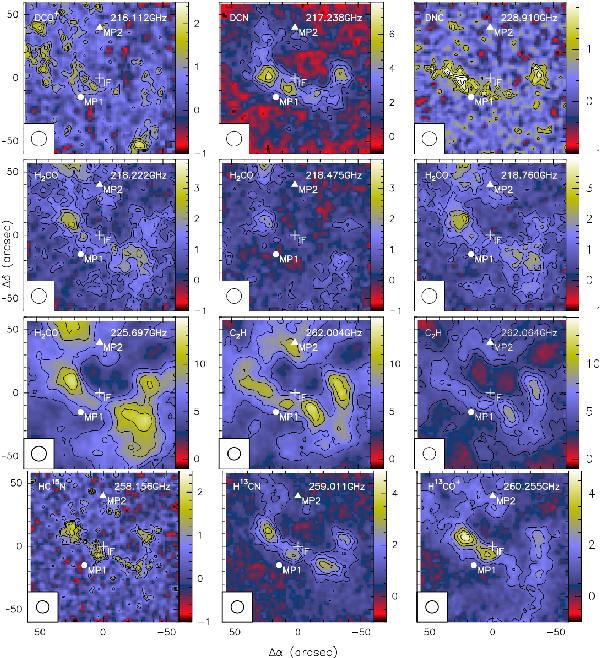
2′ × 2′ OTF maps of DCO+ (at 216.112 GHz), DCN (at 217.238 GHz), DNC (at 228.910 GHz), H2CO (218.222, 218.475, 218.760 and 225.697 GHz), C2H (at 262.004 and 262.064 GHz), HC15N (at 258.156 GHz), H13CN (at 259.011 GHz) and H13CO+ (at 260.255 GHz). The cross marks the IF position, the triangle marks the MP2 position, and the circle shows the MP1 position at the offset (− 15′′,15′′). The contour levels are 40% to 100%, in steps of 15% of the peak intensity; ~2 K km s-1 for DNC; ~3 K km s-1 for DCO+ and HC15N; ~4 K km s-1 for H2CO at ~218.00 GHz; ~5 K km s-1 for H13CN and H13CO+; ~7 K km s-1 for DCN; ~15 K km s-1 for H2CO and C2H at ~262.00 GHz.
Current usage metrics show cumulative count of Article Views (full-text article views including HTML views, PDF and ePub downloads, according to the available data) and Abstracts Views on Vision4Press platform.
Data correspond to usage on the plateform after 2015. The current usage metrics is available 48-96 hours after online publication and is updated daily on week days.
Initial download of the metrics may take a while.