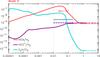
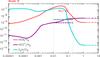
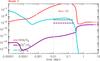
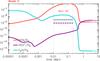
Fig. A.13

Molecular abundances relative to H2 predicted by models A to D. The input parameters of these models are shown in Table 4. The red line represents the [HCN]/[H2] ratio, the purple line shows the [HCO+]/[H2] ratio, and the blue line shows the [C2H]/[H2] ratio. The dashed lines shows the ratios of observational results toward MonR2 for the 10.5 km s-1 component at the IF position.
Current usage metrics show cumulative count of Article Views (full-text article views including HTML views, PDF and ePub downloads, according to the available data) and Abstracts Views on Vision4Press platform.
Data correspond to usage on the plateform after 2015. The current usage metrics is available 48-96 hours after online publication and is updated daily on week days.
Initial download of the metrics may take a while.