Fig. 2
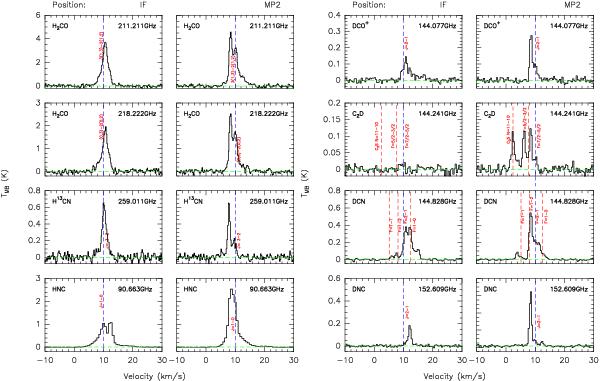
Observed spectra toward the IF and MP2 position. The blue dashed line shows the velocity of 10 km s-1 relative to the rest frequency of the transition. Two different velocity components can be distinguished at each position. Left: transitions of H2CO (211.211 and 218.222 GHz), H13CN at 259.011 GHz and HNC at 90.663 GHz (from top to bottom) at the IF and MP2 positions. Right: observed spectra for the deuterated species DCO+, C2D, DCN and DNC transitions toward the IF and MP2 positions. The velocities are relative to the frequencies 144.077, 144.241, 144.828, and 152.609 GHz (from top to bottom).
Current usage metrics show cumulative count of Article Views (full-text article views including HTML views, PDF and ePub downloads, according to the available data) and Abstracts Views on Vision4Press platform.
Data correspond to usage on the plateform after 2015. The current usage metrics is available 48-96 hours after online publication and is updated daily on week days.
Initial download of the metrics may take a while.