Fig. A.7
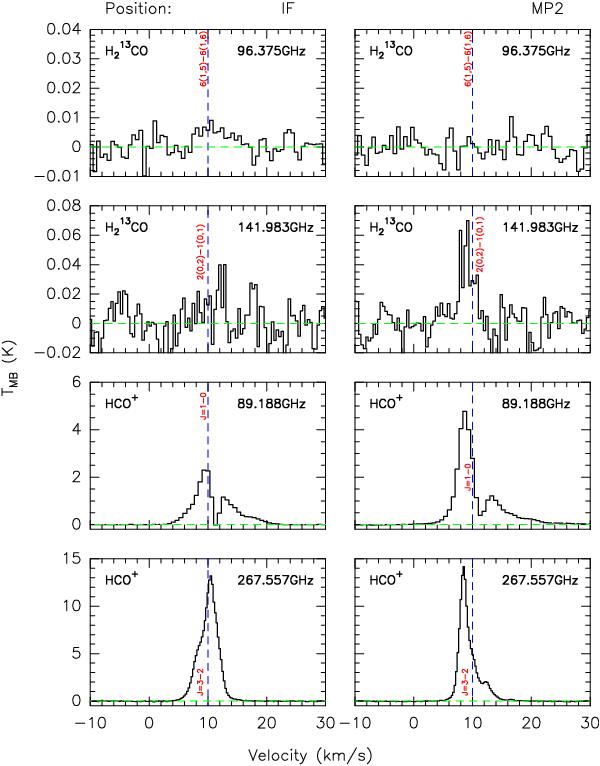
Panels 1 and 2 are the H CO spectra at the two positions IF
and MP2. The blue dashed line shows the velocity of 10 km s-1, relative to the
frequency 96.375 GHz, in panel 1, and 141.983 GHz, in
panel 2. Panels 3 and 4 show the
HCO+
spectra toward the two positions IF and MP2. The blue dashed line shows the
velocity of 10 km s-1, relative to the frequency 89.188 GHz, in
panel 3, and 267.557 GHz, in panel 4.
CO spectra at the two positions IF
and MP2. The blue dashed line shows the velocity of 10 km s-1, relative to the
frequency 96.375 GHz, in panel 1, and 141.983 GHz, in
panel 2. Panels 3 and 4 show the
HCO+
spectra toward the two positions IF and MP2. The blue dashed line shows the
velocity of 10 km s-1, relative to the frequency 89.188 GHz, in
panel 3, and 267.557 GHz, in panel 4.
Current usage metrics show cumulative count of Article Views (full-text article views including HTML views, PDF and ePub downloads, according to the available data) and Abstracts Views on Vision4Press platform.
Data correspond to usage on the plateform after 2015. The current usage metrics is available 48-96 hours after online publication and is updated daily on week days.
Initial download of the metrics may take a while.