Fig. A.6
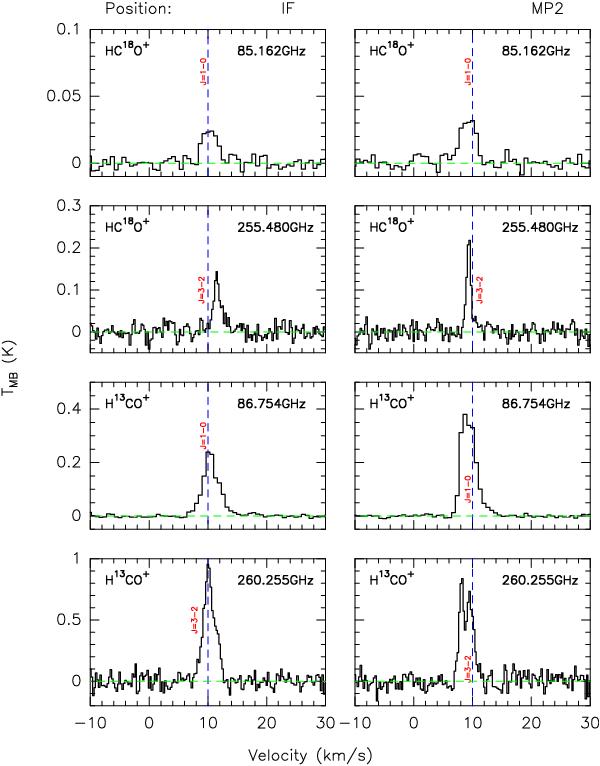
Panels 1 and 2: HC18O+ spectra at the two positions IF and MP2. Panels 3 and 4: H13CO+ spectra at the two positions IF and MP2. The blue dashed line shows the velocity of 10 km s-1, relative to the frequencies 85.162, 255.480, 86.745, and 260.255 GHz, from top to bottom.
Current usage metrics show cumulative count of Article Views (full-text article views including HTML views, PDF and ePub downloads, according to the available data) and Abstracts Views on Vision4Press platform.
Data correspond to usage on the plateform after 2015. The current usage metrics is available 48-96 hours after online publication and is updated daily on week days.
Initial download of the metrics may take a while.