Fig. 1
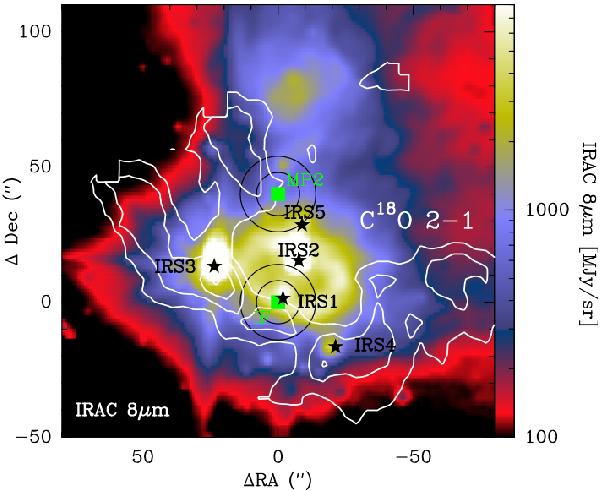
In colors, the Spitzer-IRAC 8 μm emission from small dust (Ginard et al. 2012). In contours, the integrated emission between 5 and 15 km s-1of the C18O 2–1 line (Pilleri et al. 2012a). Green squares show the two positions analyzed in this paper. Black stars show the positions of the brightest infrared sources, following the nomenclature of Henning et al. (1992). The beams at 3 mm (~29″) and 2 mm (~16″) toward the IF and MP2 positions are drawn.
Current usage metrics show cumulative count of Article Views (full-text article views including HTML views, PDF and ePub downloads, according to the available data) and Abstracts Views on Vision4Press platform.
Data correspond to usage on the plateform after 2015. The current usage metrics is available 48-96 hours after online publication and is updated daily on week days.
Initial download of the metrics may take a while.