Fig. 9
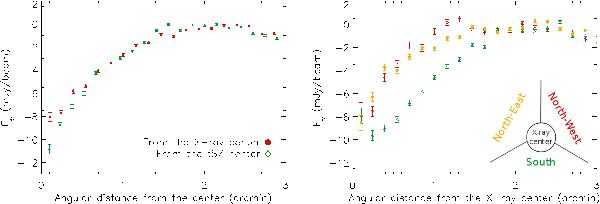
Radial flux profiles of RX J1347.5-1145. Left: comparison of the radial profile computed from the X-ray (red dots) and tSZ (green diamonds) centers. Right: comparison of the radial flux profile in three different regions from the X-ray center. The map is cut from the X-ray center in three equal slices: one cut is vertical coming from the north to the center, and the two others are diagonal from the southeast and the southwest to the center, respectively. The red diamonds and yellow dots profiles correspond to the northwest and northeast part of the map, respectively, where the cluster is expected to be rather relaxed. The green triangle profile corresponds to the southern part of the map, where the merging occurred.
Current usage metrics show cumulative count of Article Views (full-text article views including HTML views, PDF and ePub downloads, according to the available data) and Abstracts Views on Vision4Press platform.
Data correspond to usage on the plateform after 2015. The current usage metrics is available 48-96 hours after online publication and is updated daily on week days.
Initial download of the metrics may take a while.