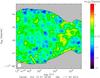
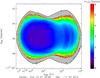
Fig. 8
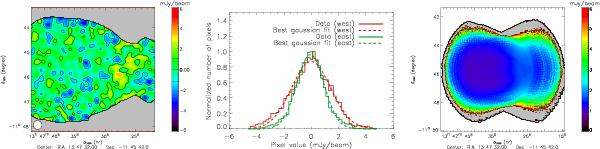
RX J1347.5-1145 observations. Left: half-difference map of two equivalent subsamples mimicking the noise properties of the tSZ map. The pixels are 2 × 2 arcsec, and the map has been smoothed with a 10 arcsec Gaussian filter, which is similar to the tSZ map of Fig. 7. The noise level is not homogeneous, which is lower on the left hand side, due to the differences of acquisition time. Middle: noise distribution obtained from the half difference map. Since the noise is not homogeneous, we provide the distribution for both the eastern (left, green) and western (right, red) parts of the map. A Gaussian fit of the histograms gives the mean value of the standard deviation of the noise to be ⟨ σ ⟩ = 0.99 mJy/beam on the east side and ⟨ σ ⟩ = 1.42 mJy/beam on the west side. The minimum noise level reaches 0.8 mJy/beam. The contours of the noise map (left) correspond to the overall mean noise (i.e. ±1.11 mJy/beam). Right: standard deviation map estimated from difference maps. White regions have not been observed. Gray regions are those for which the standard deviation is higher than 6 mJy/beam.
Current usage metrics show cumulative count of Article Views (full-text article views including HTML views, PDF and ePub downloads, according to the available data) and Abstracts Views on Vision4Press platform.
Data correspond to usage on the plateform after 2015. The current usage metrics is available 48-96 hours after online publication and is updated daily on week days.
Initial download of the metrics may take a while.