Fig. 7
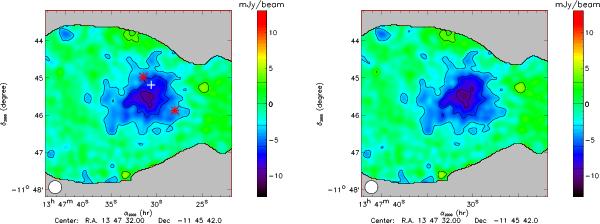
NIKA map of RX J1347.5-1145 at 140 GHz. Left: original NIKA map with the radio source not subtracted. Right: same map with the radio source subtracted. The maps are given in mJy/beam. They are clipped up to a root mean square noise level that is twice the minimum of the map as detailed in the text. The contours are at 3, −3, −6 and −9 mJy/beam with 1σ ≅ 1 mJy/beam at the cluster location. The minimum value of the maps corresponds to y ≃ 10-3. The X-ray center location is represented by a white cross. The radio source location also corresponds to the white cross within 3 arcsec. The locations of the two infrared galaxies are given as red stars.

Current usage metrics show cumulative count of Article Views (full-text article views including HTML views, PDF and ePub downloads, according to the available data) and Abstracts Views on Vision4Press platform.
Data correspond to usage on the plateform after 2015. The current usage metrics is available 48-96 hours after online publication and is updated daily on week days.
Initial download of the metrics may take a while.