Fig. 5
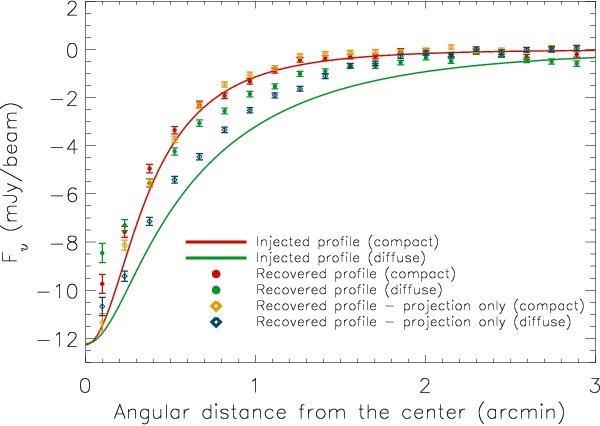
Comparison of the profiles injected in the simulation and recovered at the end of the pipeline. The injected profiles are given as red (compact cluster) and green (diffuse cluster) solid lines. The recovered profiles are shown with dots of similar colors. We also show the recovered profiles in the case of projection only without correlated noise, glitches, or pulse tube lines included in the simulation. They are given as orange (compact cluster) and blue (diffuse cluster) diamonds.
Current usage metrics show cumulative count of Article Views (full-text article views including HTML views, PDF and ePub downloads, according to the available data) and Abstracts Views on Vision4Press platform.
Data correspond to usage on the plateform after 2015. The current usage metrics is available 48-96 hours after online publication and is updated daily on week days.
Initial download of the metrics may take a while.