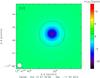
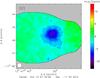
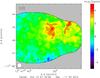
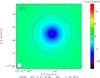
Fig. 4
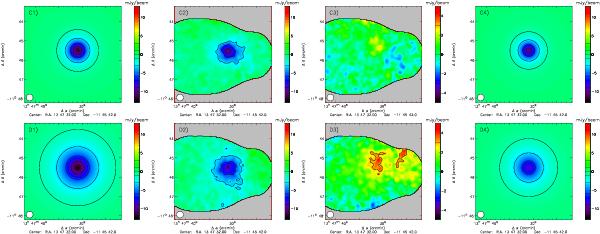
Generalized Navarro, Frenk, and White simulations of two clusters processed through the pipeline. The first one (compact cluster, as C) is similar to the NIKA map of RX J1347.5-1145 (top panels). The second (diffuse cluster, labeled D) is more extended (bottom panels). The parameters used in the cluster simulations are given in Table 4. From left to right, we show the input model maps, the recovered maps, the residual maps, and the best fit model maps of the recovered signal. They are labeled from C1 to C4 and from D1 to D4 for the compact and diffuse cluster, respectively. The maps are shown up to a noise level that is twice the minimal noise level of the map. The effective beam is shown on the bottom left corner, accounting for the instrumental beam and an extra 10 arcsec Gaussian smoothing of the maps. The contours correspond to 3, –3, –6, and –9 mJy/beam, to which we add −1 mJy/beam for the model maps. The color scales range from −13 to 13 mJy/beam, except for the residual maps for which we have −5 to 5 mJy/beam. The center of the clusters has been simulated at the tSZ peak location of the NIKA RX J1347.5-1145 map.

Current usage metrics show cumulative count of Article Views (full-text article views including HTML views, PDF and ePub downloads, according to the available data) and Abstracts Views on Vision4Press platform.
Data correspond to usage on the plateform after 2015. The current usage metrics is available 48-96 hours after online publication and is updated daily on week days.
Initial download of the metrics may take a while.