Fig. 3
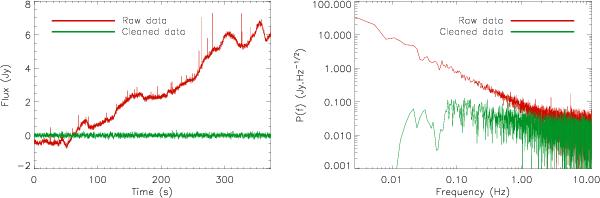
TOD (left) and their power spectra (right) for a given detector. The data corresponds to the calibrated TOD before (red) and after (green) the electronic and atmospheric noise decorrelation. The TOD are dominated by the atmospheric noise at low frequencies, which is responsible for the slow variations in the red TOD and the obvious rise of noise below ~1 Hz on the red power spectrum. Cosmic rays hitting the instrument can be seen as spikes in the TOD but have been removed before computing the power spectra. Pulse tube frequency lines appear in the power spectrum (e.g. the ~6 Hz line in the raw power spectrum) and are notch filtered. The electronic noise dominates at frequencies between ~1 and ~5 Hz in the power spectrum before decorrelation.
Current usage metrics show cumulative count of Article Views (full-text article views including HTML views, PDF and ePub downloads, according to the available data) and Abstracts Views on Vision4Press platform.
Data correspond to usage on the plateform after 2015. The current usage metrics is available 48-96 hours after online publication and is updated daily on week days.
Initial download of the metrics may take a while.