Fig. 2
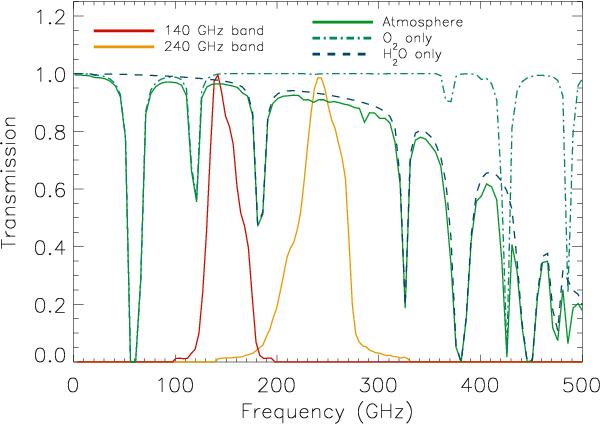
Normalized 140 GHz (solid red line) and 240 GHz (solid orange line) instrumental bandpasses. The total atmospheric transmission is also given as a solid green line for 1 mm of precipitable water vapor, according to the Pardo model (Pardo et al. 2002). The oxygen (dash-dotted light blue) and the water vapor (dashed dark blue) contributions are represented.
Current usage metrics show cumulative count of Article Views (full-text article views including HTML views, PDF and ePub downloads, according to the available data) and Abstracts Views on Vision4Press platform.
Data correspond to usage on the plateform after 2015. The current usage metrics is available 48-96 hours after online publication and is updated daily on week days.
Initial download of the metrics may take a while.