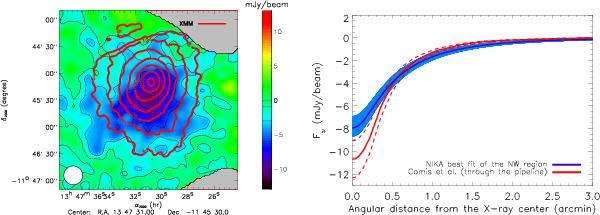
Fig. 13

Left: comparison between the RX J1347.5-1145 NIKA tSZ map and the XMM X-ray data (see the work of Gitti & Schindler 2004, 2005; Gitti et al. 2007b). The XMM map has been smoothed with a 5 arcsec Gaussian filter. The red X-ray contours are in photon counts and correspond to 6, 12, 25, 50, 100, 200, and 400. Right: comparison between the best-fit radial tSZ profile of the NIKA map, excluding the shock area (see Sect. 6.3) and the profile derived from Chandra’s data by Comis et al. (2011), which is processed through the NIKA data reduction pipeline, as discussed in Sect. 4.2. The NIKA best-fit profile is given in purple with an associated 1σ statistical error range filled in blue, and the X-ray model is given in red with the 1σ statistical error limit, as two dashed lines. See text for more details on the errors limits.
Current usage metrics show cumulative count of Article Views (full-text article views including HTML views, PDF and ePub downloads, according to the available data) and Abstracts Views on Vision4Press platform.
Data correspond to usage on the plateform after 2015. The current usage metrics is available 48-96 hours after online publication and is updated daily on week days.
Initial download of the metrics may take a while.


