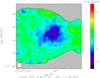
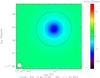
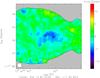
Fig. 11
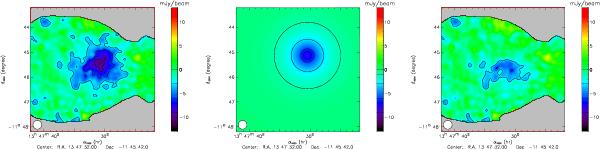
Comparison between the original point source subtracted RX J1347.5-1145 tSZ map (left panel) and the best fit model map excluding the shock area (middle panel). The residuals are given on the right panel map. The model accounts for the cluster emission well, except in the southern shocked area, as expected.
Current usage metrics show cumulative count of Article Views (full-text article views including HTML views, PDF and ePub downloads, according to the available data) and Abstracts Views on Vision4Press platform.
Data correspond to usage on the plateform after 2015. The current usage metrics is available 48-96 hours after online publication and is updated daily on week days.
Initial download of the metrics may take a while.