Fig. 10
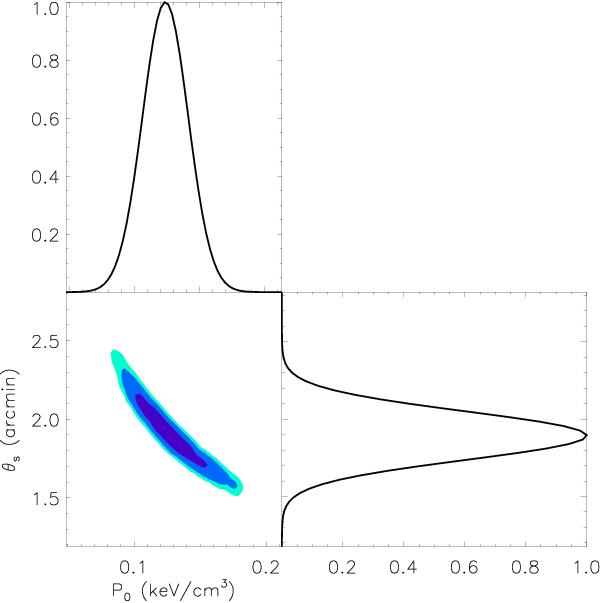
Posterior likelihood of the MCMC pressure profile fit in the plane P0 – θs. From dark to light blue, the colors correspond to 68%, 95%, and 99% confidence levels. The top and right curves show the normalized Gaussian best fit of the marginalized likelihood of P0 and θs, respectively.
Current usage metrics show cumulative count of Article Views (full-text article views including HTML views, PDF and ePub downloads, according to the available data) and Abstracts Views on Vision4Press platform.
Data correspond to usage on the plateform after 2015. The current usage metrics is available 48-96 hours after online publication and is updated daily on week days.
Initial download of the metrics may take a while.