Fig. 1
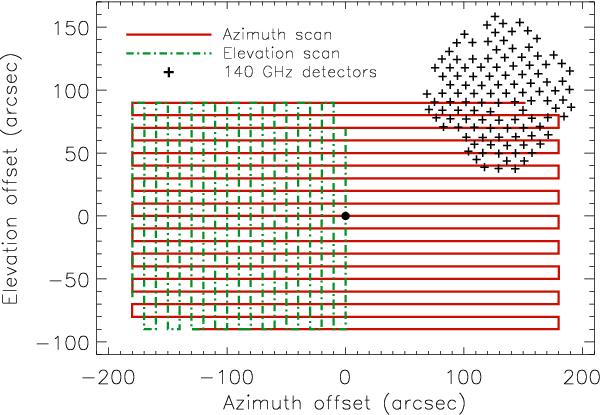
Elevation (dashed green) and azimuth (solid red) offset scans. The center is represented by a black dot and has coordinates (RA, Dec) = (13h47m32s, −11°45′42′′). The 140 GHz array is also represented by black crosses, which correspond to the position of each KID in the focal plane (gaps in the array correspond to invalid detectors).
Current usage metrics show cumulative count of Article Views (full-text article views including HTML views, PDF and ePub downloads, according to the available data) and Abstracts Views on Vision4Press platform.
Data correspond to usage on the plateform after 2015. The current usage metrics is available 48-96 hours after online publication and is updated daily on week days.
Initial download of the metrics may take a while.