| Issue |
A&A
Volume 568, August 2014
|
|
|---|---|---|
| Article Number | A33 | |
| Number of page(s) | 5 | |
| Section | Cosmology (including clusters of galaxies) | |
| DOI | https://doi.org/10.1051/0004-6361/201423653 | |
| Published online | 11 August 2014 | |
The Hubble diagram for a system within dark energy: influence of some relevant quantities
Tuorla Observatory, Department of Physics and Astronomy, University of Turku, 21500 Piikkiö, Finland
e-mail: This email address is being protected from spambots. You need JavaScript enabled to view it.
Received: 17 February 2014
Accepted: 19 June 2014
Abstract
Aims. We study the influence of relevant quantities, including the density of dark energy (DE), to the predicted Hubble outflow around a system of galaxies. In particular, we are interested in the difference between two models: 1) the standard ΛCDM model, with the everywhere constant DE density, and 2) the “Swiss cheese model”, where the Universe is as old as the standard model and the DE density is zero on short scales, including the environment of the system.
Methods. We calculated the current predicted outflow patterns of dwarf galaxies around the Local Group-like system, using different values for the mass of the group, the local DE density, and the time of ejection of the dwarf galaxies, which are treated as test particles. These results are compared with the observed Hubble flow around the Local Group.
Results. The predicted distance–velocity relations around galaxy groups are not very sensitive indicators of the DE density, owing to the observational scatter and the uncertainties caused by the mass used for the group and a range in the ejection times. In general, the Local Group outflow data agree with the local DE density being equal to the global one, if the Local Group mass is about 4 × 10¹² M⊙; a lower mass ≲ 2 × 10¹² M⊙ could suggest a zero local DE density. The dependence of the inferred DE density on the mass is a handicap in this and other common dynamical methods. This emphasizes the need to use different approaches together, for constraining the local DE density.
Key words: cosmological parameters / dark energy / Local Group
© ESO, 2014
1. Introduction
Peirani & de Freitas Pacheco (2008) and Chernin et al. (2009) calculated the present-epoch Hubble relation around galaxy groups, with and without local dark energy (DE) and pointed out differences expected in these two cases. For instance, with DE, the zero-velocity distance R0 will be shorter than without DE, for a fixed group mass. Generally, the dynamical mass determination methods will underestimate the true mass of a galaxy group (e.g., the Local Group) if one does not take the presence of possible antigravitating local DE into account. Teerikorpi & Chernin (2010) further considered the expected present-day local Hubble relation within the Einstein-Straus vacuole containing different amounts of DE, and its link to the global Hubble law.
Here we extend the previous works to include a range of relevant parameters (mass, ejection time) in order to better understand the factors influencing the use of the local Hubble flow as a measure of the DE. We concentrate on the cases where the central mass (point mass or binary), is constant, in order to see clearly the basic predictions and problems that would also go over into any perhaps more realistic and still uncertain models (such as having a changing mass).
We use the standard ΛCDM model in two ways. First, with its constant antigravitating DE density on all scales, as usually. Second, we consider the “Swiss cheese model” (SwCh), where the Universe has the same age as the standard model, but the DE density is zero on short scales. This could correspond to the case where DE (or analogous effects) only operates on large scales. Thus, our results are concerned with the presence (or not) of local DE within the framework of the ΛCDM model and are not directly applicable to models that differ much from the standard paradigm, such as those arising, say, from the application of Milgromian gravity (e.g., Zhao et al. 2013).
2. Dark energy on local scales
Our starting point is the outflow model (Chernin 2001; Chernin et al. 2006; Byrd et al. 2012) intended to describe the major features of expansion flows around local masses, which was motivated by the observed picture of the Local Group with outflowing dwarf galaxies around it (e.g., van den Bergh 1999; Karachentsev et al. 2009). The model treats the dwarfs as “test particles” moving in the force field produced by the gravitating mass of the group and the possible DE background.
In order to see the main expected features, one may consider a spherical “vacuole”, as given by the exact Einstein-Straus solution (Einstein & Straus 1945; Chernin et al. 2006). The vacuole may be seen as defining the region from which the central mass M (the galaxy group) has been gathered. In the vacuole, the Köttler solution gives an exact description of a spherically-symmetrical spacetime (the Schwarzschild-de Sitter spacetime) outside a spherical mass M within DE of constant density ρde. When the gravity/antigravity field is weak, one may write (Chernin et al. 2006) the force affecting a test particle with mass m as the sum of the Newtonian gravity force produced by the mass M and the Einstein force of antigravity due to DE: 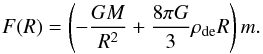 (1)A gravitationally bound group is located within its zero-gravity sphere having the radius R = RZG (Chernin 2001):
 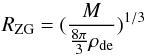 (2)At this distance, gravity = antigravity. If the mass is, say, 2 × 10¹² M⊙ and the local DE density is equal to its global value ρΛ, ρΛ ≈ 7 × 10-30 g/cm3, then RZG = 1.3 Mpc.
3. Local outflow
The radial motion of the flow is controlled by the force field given by Eq. (1), and the equation of motion at R ≥ RZG is 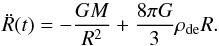 (3)The first integral of this equation is
  (4)where E is the constant total mechanical energy of the particle.
The potential energy expression 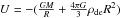 in Eq. (4) has the maximum
  at R = RZG. From this it follows, putting Ṙ = 0, that for a particle to escape from the potential well of the group, its energy E must exceed
  , which defines the lowest possible velocity in the outflow (Chernin et al. 2006; see also Fig. 1 in Teerikorpi et al. 2008). This general energy constraint does not depend on the time of ejection. However, because the ejection happened a finite time ago, the lowest current velocity allowing the particle to have reached a distance R is generally higher than this lower limit.
The local flow is generally not linear, which is due to the non-uniform, point-like matter distribution, and the presently observed Hubble flow consists of objects having different energies E, while in the global flow of uniform matter, the trajectories are parabolic (the total energy E = 0 in Eq. (4)). If, say, two objects with equal energies were expelled at different past times, they should still lie on the trajectory corresponding to that same energy. However, if the objects had a range of different energies when expelled at the same past time, their presently observed distance-velocity locus is made of pieces of trajectories for different E = E(R) (Chernin et al. 2009; Teerikorpi & Chernin 2010). The true situation could be a mixture of these variants: a range of energies and a range of expulsion times.
If expelled at the same time the present-day outflow of the objects thus depends on the mass of the group, the flight time (≲ the age of the Universe), and the local DE density.
4. The method of calculation
Peirani & de Freitas Pacheco (2008) derived the velocity-distance relation using the Lemaître-Tolman (LT) model containing the cosmological constant, and compared this with the LT-model result for Λ = 0, using the central mass and the Hubble constant as free parameters. Chernin et al. (2009) constructed the expected present Hubble relation by considering the total energy for different outflow velocities at a fixed distance from the group, and then calculating the required time for the test particle to fly from near the group’s center of mass up to this distance. The locus of the points corresponding to a constant age (≈ the age of the Universe) gave the expected relation.
Here we use a variant of the above methods that easily allows one to vary the values of the relevant parameters and to generalize the model in various ways. We generate test particles close to the center of mass of the group and give them a distribution of speeds. Then we let them fly along the radial direction for a time T, and their distances from the center are noted. The flight time T, during which the integration of the equations of motion is performed, is at most the age of the standard Universe, 13.7 Gy. The locus of the points corresponds to the distance-velocity relation as observed at the present time.
Figure 1 illustrates the method by showing the relevant kinematial curves for two background models with the same age. We see that in the standard model, the particles reach larger distances, while in the SwCh model the distances are shorter because only gravitation is acting. We also see that individual particles can reach quite different distances even for the same initial conditions. The final present-day relations also differ, but not very much. The difference tends to follow what was already noted by Peirani & de Freitas Pacheco (2008) and Chernin et al. (2009): models with no DE tend to give a shallower local Hubble relation and a longer zero-velocity distance.
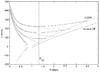 |
Fig. 1 Trajectories of test particles as injected from the mass center (example curves starting at R = 0). The particles are initially given different velocities and then allowed to travel for a given time T0 (=13.7 Ga here). The end points of the curves show the locations at the time T0. The curves marked “ΛCDM” and “no local DE” are the loci of the various particles at the time T0 for the standard model (with DE on all scales) and for the Swiss Cheese model (no DE on local scales), respectively. The vertical line shows the zero-gravity distance. We note the minimum velocity at R = RZG for each ΛCDM model trajectory. Here the central mass is 2 × 10¹² M⊙. |
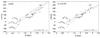 |
Fig. 2 Left panel: location of test particles as injected from the mass center (curves) after the flight time T0 = 12.7 Ga, for different masses (1 × 10¹² M⊙,2 × 1012 M⊙,4 × 1012 M⊙). Here the standard model is used (local DE = global DE). Right panel: same for the Swiss cheese model (no local DE). The data points are for the Local Group. |
5. Different models and parameter values: results
The case where the particles have left the center just after the Big Bang would correspond to the situation where the outflow around the central group is “primordial”. This is the usual approach adopted, for instance, in the classical work by Sandage (1986). We also show some results for 1 and 2 Gy after the Big Bang. In practice, the age of the group and the outflowing dwarf galaxies must be less than the age of the Universe, and the origin of the outflow may be due to early interactions within the system, making galaxies escape from it (e.g., Byrd et al. 1994, 2012; Chernin et al. 2004). The DE antigravity enhances the escape probability because it makes the particle potential energy barrier lower than in the presence of gravity alone.
We plot the results together with the data on the local outflow around the Local Group from the Hubble diagram as derived by Karachentsev et al. (2009) from HST observations. The largest available distance is 3 Mpc. In their data the distances refer to the centroid of the Local Group, which they took to be at the distance of 0.43 Mpc from the Milky Way toward M 31 (the distance between them being 0.78 Mpc).
5.1. Point-mass model: influence of mass
Figure 2 shows the predicted distance–velocity curves for different masses in the ΛCDM and the SwCh model. The location of the curve is seen to depend rather strongly on the adopted mass. A higher mass makes the location of the curve lower (or increases the zero-velocity distance). A factor of two uncertainty in the used mass makes it difficult to decide between the standard model and the SwCh model. For instance, using too low a value of mass can lead one to conclude that there is no local DE, even if there is.
Of the models shown, only the SwCh model with M = 4 × 10¹² M⊙ and the standard model with M = 1 × 10¹² M⊙ seem to be excluded in light of the Local Group data. By eye, the SwCh curve with M = 2 × 10¹² M⊙ gives a good fit for the LG data in the full distance range. In fact, the most likely fitting mass for the SwCh model is 1.5 × 10¹² M⊙, as determined by the least squares method. The ΛCDM model requires M ≈ 4 × 10¹² M⊙ for a good fit beyond the zero-gravity distance (as already noted by Chernin et al. (2009). The results illustrate the importance of knowing the true mass in some independent way.
5.2. Point-mass model: influence of ejection time
Figure 3 shows the predictions for the Hubble relation when the test particles have been ejected at three different times, 0, 1, and 2 Ga after the Big Bang. Later ejected particles will have higher velocities, if observed now. This corresponds to the inverse relation between the global Hubble constant and the Hubble time in Friedmann models. The later the particles have been ejected, the lower the local DE density should be for the prediction to agree with the data for a fixed mass.
5.3. Binary model
The Local Group has two main components, the Milky Way and M 31. It is in fact this binary structure, which has been suggested as a possible source for the ejection of dwarf galaxies (Chernin et al. 2004). On the other hand, the zero-gravity surface as calculated for the Local Group is almost spherically symmetric at relevant distances (see Fig. 1 in Chernin et al. 2009), so one would not expect a strong effect.
We checked the influence of the binary structure on the distance-velocity relation by comparing the point-mass result with the binary-structure result in two extreme directions: perpendicular to the components and parallel to the components. Appendix A gives the used force laws. Figure 4 shows that the expected spread due to the binary mass point structure is indeed rather narrow in comparison with the other factors.
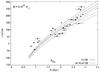 |
Fig. 3 Location of test particles as injected from the mass center (curves) after the flight times T0 = 13.7 Ga, T0 = 12.7 Ga, and T0 = 11.7 Ga for the mass M = 4 × 10¹² M⊙. A spread in ejection times will increase the scatter. Particles that have been ejected later are found on higher trajectories. The lowest curves of the two triplets correspond to the age of the Universe. |
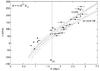 |
Fig. 4 Location of test particles as injected from the mass center after the flight time T0 = 12.7 Ga for the point mass M = 4 × 10¹² M⊙ (the solid curves) and for the binary structure in perpendicular direction (the upper dashed curve) and in parallel direction (the lower dotted curve).The upper triplet of curves corresdonds to the standard model, while the lower triplet is for the Swiss cheese model. |
6. Discussion and conclusions
Our calculations show clear differences between the cases of ΛCDM and no local DE. In practice, the difference may be difficult to detect. First, the observed distance–velocity relation is fairly scattered, roughly covering a similar region in the r − V diagram as the theoretical curves. Second, the independently known masses of the galaxy groups (even our Local Group) are uncertain. Third, the evolution of a galaxy group contains uncertain elements, including the ejection time.
We saw that for the Hubble flow around the Local Group to be approximately consistent with the condition ρloc = ρΛ, a rather high mass ≈4 × 10¹² M⊙ is required. The usually cited ≈2 × 10¹² M⊙ would suggest about zero local DE density. Indeed, one point to emphasize is the interdependence of the assumed mass and the inferred DE density. This occurs here and also in other common dynamical methods, such as the virial theorem and the Kahn-Woltjer methods (Chernin et al. 2009).
In fact, attempts to probe DE with nearby outflows were first made (e.g., Chernin et al. 2006; Teerikorpi et al. 2008) by using the zero-gravity radius (Eq. (2)). This method is also affected by the “mass–dark energy degeneracy”. If the possible range of RZG is somehow estimated from the velocity–distance diagram1 and the mass M of the group is independently known or assumed, the DE density may be estimated in the outflow region: 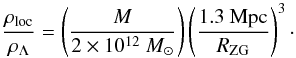 (5)Here the DE density is directly proportional to the mass. As a result, Eq. (5) may give useful constraints on the DE density for methods where the ρloc vs. M dependence is shallower, such as the modified Kahn-Woltjer method, which results in a non-horizontal, elongated area of admissible values in the local DE density–mass diagram. Thus Chernin et al. (2009) used the relative velocity and distance of our Galaxy and the M 31 galaxy together with the outflow data to derive the local DE density as ρloc/ρΛ = 0.8 − 3.8. Using a similar approach, Byrd et al. (2014) revised this range to ρloc/ρΛ ≈ 0.5 − 2.5.
It should be noted that since we consider the dwarf galaxies that have managed to escape from the Local Group and are well outside it, we may ignore the details of the early processes that gave them the required threshold energy. The recently found planar structures in the distribution of the satellite galaxies of the Milky Way and M 31 (Pawlowski et al. 2013), when understood, may cast light on the early history of the Local Group and may be relevant to more realistic calculations than the present ones. In fact, it has been argued that their existence may be a problem for the ΛCDM framework (Kroupa 2012). In one alternative scheme, the Milgrom gravity, the dynamical history of the Milky Way and M 31 differs from that in the ΛCDM model, with an encounter expected to have occurred 7 to 11 Ga ago (Zhao et al. 2013), when part of the outflying dwarf galaxies might have been formed. This is a point to be noted in any analysis of the local Hubble outflow using the Milgrom gravity law.
Finally, we note that our point-mass model does not inlude dynamical friction, making the results comparable to previous works cited in Sect.1. In the ΛCDM picture, instead of a test particle receeding from the central mass, dark matter halos would move within the extended halo of the Local Group, which results in an additional force term owing to the dynamical friction for an inner part of the trajectory. Since the ouflowing dwarf galaxies are quite small, their luminosities being typically less than 1/100 of the Milky Way’s luminosity (Karachentsev et al. 2009). one might suppose that the friction would be a minor factor, as a first approximation. However, the actual level of sensitivity of the outflow predictions to the dynamical friction is a topic to address in a separate study.
We summarize the conclusions as follows:
-
The outflows around galaxy groups, though theoretically clearly influenced by local DE, are not very sensitive indicators of the exact value of the DE density in view of the obsevational scatter in the distance-velocity diagrams, as already noted by Peirani & de Freitas Pacheco (2008), and the uncertainties caused by the adopted mass of the group, a range in the assumed ejection times, and the binary nature of the group. Tthe uncertainties in mass and time are especially harmful.
-
In general, the Local Group outflow data agree with the local DE density being equal to the global one, if the mass is about 4 × 10¹² M⊙. A lower mass ≲2 × 10¹² M⊙ could suggest a zero local DE density. We note that there has been a trend toward ascribing a mass ≳3 × 10¹² M⊙ to the Local Group, especially from new applications of the Kahn-Woltjer timing method, both without the Λ-term (Li & White 2008; van der Marel et al. 2012; Gonzalez et al. 2013) and with non-zero Λ (Chernin et al. 2009; Partridge et al. 2013). The ΛCDM-based high resolution cosmological simulations easily produce such Local Group-analogs (Garrison-Kimmel et al. 2014). We also note that 4 × 10¹² M⊙ would correspond to the M/LV ratio ≈75 (van den Bergh 1999), which does not contradict the observed M/L ratios of galaxy groups of this virial mass (Girardi et al. 2002).
-
Theoretically, local dynamics on galaxy-group (a few Mpc) scales significantly differ for the cases of local DE = global DE or = 0 (e.g., Chernin et al. 2009; Byrd et al. 2012), though any single method (e.g., local outflows, the Kahn-Woltjer method, the virial theorem) have large uncertainties. It is therefore desirable to consider different methods together in order to lower systematic and random errors (Chernin et al. 2009; Byrd et al. 2014).
According to our calculations, the Hubble relation of the outflow does not show any clear signature of the zero-gravity distance. However, Teerikorpi & Chernin (2010) show that if the outflow reaches the global Hubble rate at a distance R2 from the group, the zero-gravity radius is expected to lie at ≲ R2/1.5.
Acknowledgments
We are grateful for discussions with G. Byrd, A. C. Chernin, and M. Valtonen. We also thank the anonymous referee for careful reading of the manuscript and useful comments.
References
- Byrd, G. G., Valtonen, M. J., McCall, M. L., & Innanen, K. A. 1994, AJ, 107, 2055 [NASA ADS] [CrossRef] [Google Scholar]
- Byrd, G. G., Chernin A. D., Teerikorpi, P., & Valtonen, M. 2012, Paths to Dark Energy, Theory and Observation (Berlin: De Gruyter) [Google Scholar]
- Byrd, G. G., Chernin A. D., Teerikorpi, P., & Valtonen, M. 2014, Observations of General Relativity at strong and weak limits, in General Relativity: The most beautiful of theories: Applications and trends after 100 years, ed. C. Rovelli (Berlin: De Gruyter), in press [Google Scholar]
- Chernin, A. D. 2001, Physics-Uspekhi, 44, 1099 [NASA ADS] [CrossRef] [Google Scholar]
- Chernin, A. D., Karachentsev, I. D., Valtonen, M. J., et al. 2004, A&A, 415, 19 [NASA ADS] [CrossRef] [EDP Sciences] [Google Scholar]
- Chernin, A. D., Teerikorpi, P., & Baryshev, Yu. V. 2006, A&A, 456, 13 [Google Scholar]
- Chernin, A. D., Teerikorpi, P., Valtonen, M. J., et al. 2009, A&A, 507, 1271 [NASA ADS] [CrossRef] [EDP Sciences] [Google Scholar]
- Einstein, A., & Straus, E. G. 1945, Rev. Mod. Phys., 17, 120 [NASA ADS] [CrossRef] [Google Scholar]
- Garrison-Kimmel, S., Boylan-Kolchin, M., Bullock, J., & Lee, K. 2014, MNRAS, 438, 2578 [NASA ADS] [CrossRef] [Google Scholar]
- Girardi, M., Manzato, P., & Mezzetti, M. 2002, ApJ, 569, 720 [NASA ADS] [CrossRef] [Google Scholar]
- Gonzalez, R. E., Kravtsov, A. V., & Gnedin, N. Y. 2013, ApJ, submitted [arXiv:1312.2587] [Google Scholar]
- Karachentsev, I. D., Kashibadze, O. G., Makarov, D. I., & Tully, R. B. 2009, MNRAS, 393, 1265 [NASA ADS] [CrossRef] [Google Scholar]
- Kroupa, P. 2012, PSA, 29, 395 [Google Scholar]
- Li, Y. S., & White, S. D. M. 2008, MNRAS, 384, 1459 [NASA ADS] [CrossRef] [Google Scholar]
- Partridge, C., Lahav, O., & Hoffman, Y. 2013, MNRAS, 436, 45 [Google Scholar]
- Pawlowski, M. S., Kroupa, P., & Jerjen, H. 2013, MNRAS, 435, 1928 [NASA ADS] [CrossRef] [Google Scholar]
- Peirani, S., & de Freitas Pacheco, J. A. 2008, A&A, 488, 845 [NASA ADS] [CrossRef] [EDP Sciences] [Google Scholar]
- Sandage, A. 1986, ApJ, 307, 1 [NASA ADS] [CrossRef] [Google Scholar]
- Teerikorpi, P., & Chernin, A. D. 2010, A&A, 516, 93 [Google Scholar]
- Teerikorpi, P., Chernin, A. D., Karachentsev, I. D., & Valtonen, M. J. 2008, A&A, 483, 383 [NASA ADS] [CrossRef] [EDP Sciences] [Google Scholar]
- van den Bergh, S. 1999, A&ARv, 9, 273 [NASA ADS] [CrossRef] [Google Scholar]
- van der Marel, R. P., Fardal, M., Besla, G., et al. 2012, ApJ, 753, 8 [NASA ADS] [CrossRef] [Google Scholar]
- Zhao, H., Famaey, B., & Lüghausen, K. P. 2013, A&A, 557, L3 [NASA ADS] [CrossRef] [EDP Sciences] [Google Scholar]
Appendix A: Force laws in the binary model
In the binary model the perpendicular force is taken to have the form 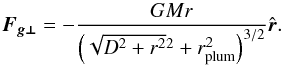 (A.1)The parallel force is
 ![Mathematical equation: \appendix \setcounter{section}{1} \begin{equation} \vec{F_{g\|}}= - \left[\frac{GM(r+D)}{\left((r+D)^2+r_{\rm{plum}}^2\right)^{3/2}} + \frac{GM(r-D)}{\left((r-D)^2+r_{\rm{plum}}^2\right)^{3/2}}\right] \hat{\vec{r}}. \end{equation}](/articles/aa/full_html/2014/08/aa23653-14/aa23653-14-eq59.png) (A.2)Here D = 0.35, about one half of the distance between our Galaxy and M 31 and rplum is the Plummer radius, taken to be 0.1 Mpc. The total mass = 4 × 10¹² M⊙ has been divided equally between the two components.
(A.2)Here D = 0.35, about one half of the distance between our Galaxy and M 31 and rplum is the Plummer radius, taken to be 0.1 Mpc. The total mass = 4 × 10¹² M⊙ has been divided equally between the two components.
All Figures
|
Fig. 1 Trajectories of test particles as injected from the mass center (example curves starting at R = 0). The particles are initially given different velocities and then allowed to travel for a given time T0 (=13.7 Ga here). The end points of the curves show the locations at the time T0. The curves marked “ΛCDM” and “no local DE” are the loci of the various particles at the time T0 for the standard model (with DE on all scales) and for the Swiss Cheese model (no DE on local scales), respectively. The vertical line shows the zero-gravity distance. We note the minimum velocity at R = RZG for each ΛCDM model trajectory. Here the central mass is 2 × 10¹² M⊙. |
| In the text | |
|
Fig. 2 Left panel: location of test particles as injected from the mass center (curves) after the flight time T0 = 12.7 Ga, for different masses (1 × 10¹² M⊙,2 × 1012 M⊙,4 × 1012 M⊙). Here the standard model is used (local DE = global DE). Right panel: same for the Swiss cheese model (no local DE). The data points are for the Local Group. |
| In the text | |
|
Fig. 3 Location of test particles as injected from the mass center (curves) after the flight times T0 = 13.7 Ga, T0 = 12.7 Ga, and T0 = 11.7 Ga for the mass M = 4 × 10¹² M⊙. A spread in ejection times will increase the scatter. Particles that have been ejected later are found on higher trajectories. The lowest curves of the two triplets correspond to the age of the Universe. |
| In the text | |
|
Fig. 4 Location of test particles as injected from the mass center after the flight time T0 = 12.7 Ga for the point mass M = 4 × 10¹² M⊙ (the solid curves) and for the binary structure in perpendicular direction (the upper dashed curve) and in parallel direction (the lower dotted curve).The upper triplet of curves corresdonds to the standard model, while the lower triplet is for the Swiss cheese model. |
| In the text | |
Current usage metrics show cumulative count of Article Views (full-text article views including HTML views, PDF and ePub downloads, according to the available data) and Abstracts Views on Vision4Press platform.
Data correspond to usage on the plateform after 2015. The current usage metrics is available 48-96 hours after online publication and is updated daily on week days.
Initial download of the metrics may take a while.