Fig. 1
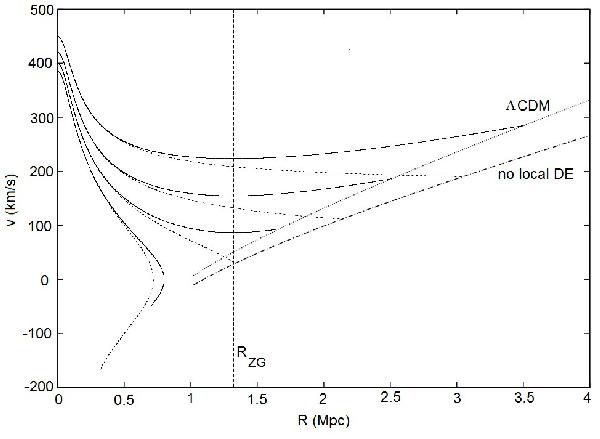
Trajectories of test particles as injected from the mass center (example curves starting at R = 0). The particles are initially given different velocities and then allowed to travel for a given time T0 (=13.7 Ga here). The end points of the curves show the locations at the time T0. The curves marked “ΛCDM” and “no local DE” are the loci of the various particles at the time T0 for the standard model (with DE on all scales) and for the Swiss Cheese model (no DE on local scales), respectively. The vertical line shows the zero-gravity distance. We note the minimum velocity at R = RZG for each ΛCDM model trajectory. Here the central mass is 2 × 10¹² M⊙.
Current usage metrics show cumulative count of Article Views (full-text article views including HTML views, PDF and ePub downloads, according to the available data) and Abstracts Views on Vision4Press platform.
Data correspond to usage on the plateform after 2015. The current usage metrics is available 48-96 hours after online publication and is updated daily on week days.
Initial download of the metrics may take a while.