Fig. 4
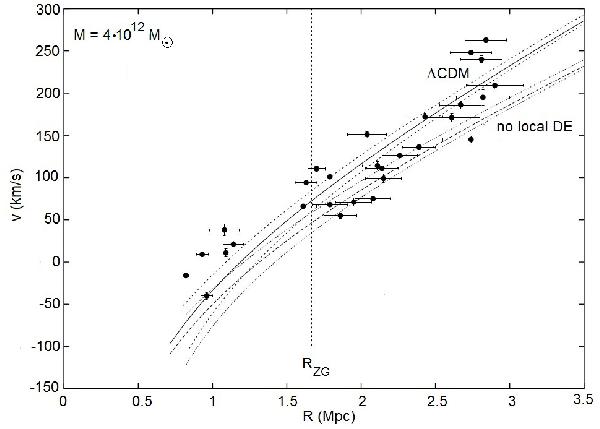
Location of test particles as injected from the mass center after the flight time T0 = 12.7 Ga for the point mass M = 4 × 10¹² M⊙ (the solid curves) and for the binary structure in perpendicular direction (the upper dashed curve) and in parallel direction (the lower dotted curve).The upper triplet of curves corresdonds to the standard model, while the lower triplet is for the Swiss cheese model.
Current usage metrics show cumulative count of Article Views (full-text article views including HTML views, PDF and ePub downloads, according to the available data) and Abstracts Views on Vision4Press platform.
Data correspond to usage on the plateform after 2015. The current usage metrics is available 48-96 hours after online publication and is updated daily on week days.
Initial download of the metrics may take a while.