| Issue |
A&A
Volume 567, July 2014
|
|
|---|---|---|
| Article Number | L9 | |
| Number of page(s) | 6 | |
| Section | Letters | |
| DOI | https://doi.org/10.1051/0004-6361/201424041 | |
| Published online | 05 August 2014 | |
Physical and orbital properties of β Pictoris b⋆
1 Université Grenoble Alpes, IPAG, 38000 Grenoble, France
e-mail: bonnefmi@obs.ujf-grenoble.fr
2 CNRS, IPAG, 38000 Grenoble, France
3 Max Planck Institute for Astronomy, Königstuhl 17, 69117 Heidelberg, Germany
4 LESIA, CNRS, Observatoire de Paris, Univ. Paris Diderot, UPMC, 5 place Jules Janssen, 92190 Meudon, France
5 Department of Physics, McGill University, 3600 rue University, Montréal, Québec, H3A 2T8, Canada
6 SUPA, School of Physics and Astronomy, University of St Andrews, St Andrews, KY16 9SS, UK
7 CRAL, UMR 5574, CNRS, Université de Lyon, École Normale Supérieure de Lyon, 46 allée d’Italie, 69364 Lyon Cedex 07, France
Received: 21 April 2014
Accepted: 13 July 2014
The intermediate-mass star β Pictoris is known to be surrounded by a structured edge-on debris disk within which a gas giant planet was discovered orbiting at 8−10 AU. The physical properties of β Pic b were previously inferred from broad- and narrow-band 0.9−4.8 μm photometry. We used commissioning data of the Gemini Planet Imager (GPI) to obtain new astrometry and a low-resolution (R ~ 35−39) J-band (1.12−1.35 μm) spectrum of the planet. We find that the planet has passed the quadrature. We constrain its semi-major axis to ≤10 AU (90% prob.) with a peak at 8.9+0.4-0.6 AU. The joint fit of the planet astrometry and the most recent radial velocity measurements of the star yields a planet dynamical mass lower than 20 MJup (≥96% prob.). The extracted spectrum of β Pic b is similar to those of young L1-1.5+1 dwarfs. We used the spectral type estimate to revise the planet luminosity to log (L/L⊙) = −3.90 ± 0.07. The 0.9−4.8 μm photometry and spectrum are reproduced for Teff = 1650 ± 150 K and a log g ≤ 4.7 dex by 12 grids of PHOENIX-based and LESIA atmospheric models. For the most recent system age estimate (21 ± 4 Myr), the bolometric luminosity and the constraints on the dynamical mass of β Pic b are only reproduced by warm- and hot-start tracks with initial entropies Si> 10.5 kB/baryon. These initial conditions may result from an inefficient accretion shock and/or a planetesimal density at formation higher than in the classical core-accretion model. Considering a younger age for the system or a conservative formation time for β Pic b does not change these conclusions.
Key words: techniques: photometric / techniques: spectroscopic / planetary systems / stars: individual:βPic
Appendices are available in electronic form at http://www.aanda.org
© ESO, 2014
1. Introduction
A candidate giant planet was identified in 2003 high-resolution imaging data at a projected separation of 9 AU in the disk of the intermediate-mass star β Pictoris (Lagrange et al. 2009). Follow-up images of the system with various instruments (Lagrange et al. 2010; Boccaletti et al. 2013; Males et al. 2014) from 0.98 μm to 4.8 μm enabled us to confirm that β Pic b is bound to the star and has a hot (Teff ~ 1700 K) and dusty atmosphere (Bonnefoy et al. 2013; Currie et al. 2013; Males et al. 2014, and references therein). The monitoring of the planet’s orbital motion restrained the semi-major axis (s.m.a.) estimates to 8−10 AU (Chauvin et al. 2012; Absil et al. 2013). Combined with radial velocity (RV) measurements (Lagrange et al. 2012, 2013), the s.m.a. ≤ 10 AU (80% prob.) set an upper limit of 15.5 MJup on the mass of β Pic b for the case of a circular orbit.
The dynamical mass constraints, the Teff and luminosity of the planet, and the system age provide a so far unique test of evolutionary models predictions. “Hot-start” models predict β Pic b to be a 8 to 12.6 MJup planet. “Cold-start” models assume that the gravitational potential energy of the infalling gas at formation is fully radiated away at a supercritical accretion shock. These tracks cannot reproduce the measured photometry of β Pic b for planet masses below 15.5 MJup. “Warm-start” models (Spiegel & Burrows 2012; Marleau & Cumming 2014, hereafter SB12 and MC14) explore the sensitivity of the mass prediction to the initial conditions, parametrized by the choice of an initial entropy (Si). Bonnefoy et al. (2013) and Marleau & Cumming (2014), demonstrated that the properties of β Pic b can only be reproduced for Si ≥ 9.3kB/baryon, i.e. initial conditions intermediate between cold and hot-start cases. But these predictions relied 1) on a system age of  Myr (Zuckerman et al. 2001) and 2) on the hypothesis of a non-eccentric orbit for the planet. Since then, Binks & Jeffries (2014) reported a lithium depletion age of 21 ± 4 Myr for the β Pictoris moving group.
In this Letter, we present new astrometry and the first J-band spectrum of β Pic b extracted from commissioning data of the Gemini Planet Imager (Macintosh et al. 2014) instrument (Sect. 2). We use these data in Sect. 3 and up-to-date RV measurements on the star to refine the constraints on the orbital elements, on the dynamical mass (Sect. 3), the physical properties, and ultimately, the formation conditions of the planet (Sect. 4).
2. Observations and data reduction
The source was observed with GPI on Dec. 10, 2013. The observations combined integral field spectroscopy with apodized Lyot coronagraphy (diameter = 184 mas) and angular differential imaging (ADI, Marois et al. 2006b). The data set is composed of 19 spectral cubes consisting of 37 spectral channels each. They cover the J band (1.12−1.35 μm) at a low resolving power (R = 35−39). Data were obtained under good conditions (⟨ τ0 ⟩ = 14.5 ms, DIMM seeing = 0.7′′), low average airmass (1.08), and covered a field rotation of 19.8°.
We used the spectral cubes provided by the GPI pipeline1. To further process the data, we first registered each slice of the cubes using the barycenter of the four satellite spots (attenuated replica of the central star PSF induced by a grid placed in the pupil plane, Marois et al. 2006a). We minimized the speckle noise in each slice using the IPAG and LESIA ADI pipelines (whithout spectral differential imaging to minimize biases on the extracted photometry). The IPAG pipeline used the cADI, sADI, and LOCI methods (see Chauvin et al. 2012, and references therein). The LESIA pipeline relied on the TLOCI algorithm (Marois et al. 2014).
To estimate the planet photometry and astrometry in each spectral channel, we assessed biases induced by our algorithms by injecting fake point-sources into the data cubes built from the average of the four unsaturated spots over the spectral and time sequence (Galicher et al. 2014) before applying ADI speckle-suppression techniques (Bonnefoy et al. 2011). We used the GPI spot-to-central-star flux-ratio that was calibrated in laboratory (9.36 mag at J band) to obtain the planet-to-star contrast in each spectral channel. We multiplied these contrasts by a template spectrum of β Pic A to retrieve the planet spectrum. The template was built by taking the mean of A5V and A7V star spectra from the Pickles (1998) library (see Males et al. 2014). We find a synthetic photometry of J2MASS = 14.1 ± 0.3 mag for the planet consistent with the value reported in Bonnefoy et al. (2013). The photometric error is given by the quadratic sum of the uncertainty on the spot-to-star contrast (0.15 mag; courtesy of the GPI consortium), on the planet flux measurement (0.06 mag) and the variation of the spot flux over the full sequence (0.1 mag). The uncertainty on the planet flux measurement and the variation of the spot flux were estimated as in Galicher et al. (2014). The astrometry is reported in Table 1. The associated error is the quadratic sum of uncertainties on the centroiding accuracy of individual slices (0.3 pixel), the platescale (0.02 pixel), the planet template fit (0.1 pixel at J), and the north position angle (1 deg; see the GPI instrument page1).
Astrometry for β Pic b.
3. Orbit and dynamical mass of β Pic b
We combined the GPI relative astrometry of β Pic b (Table 1) with previous NaCo measurements (Chauvin et al. 2012; Bonnefoy et al. 2013; Absil et al. 2013) to refine the orbital solutions of the object based solely on the astrometry. We used the Markov-chain Monte Carlo (MCMC) Bayesian analysis technique described in Chauvin et al. (2012) to derive the probablilistic distribution of orbital solutions. The new GPI astrometric measurements confirm that β Pic b has now passed the quadrature. The semi-major axis distribution is now greatly improved and exhibits a clear peak at  AU (Fig. 1). The probability distributions of other orbital parameters remain consistent with the previous estimations of Chauvin et al. (2012) and Absil et al. (2013). The probability that β Pic b actually transits along the line of sight is 2%. If this is the case, the next transiting event is expected for mid-2017. These conclusions are consistent with the analysis inferred from GPI H band (1.65 μm) data of the system obtained on Nov. 18, 2013 (Macintosh et al. 2014).
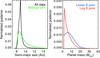 |
Fig. 1 Left: MCMC distribution for the semi-major axis of β Pic b, with (black curve) and without (green curve) the new GPI data. Right: dynamical mass distribution of β Pic b inferred from the MCMC fit of the combined planet astrometry and RV measurements of the star. The two priors considered here give two different distributions (see Appendix A). |
We tried to constrain the mass of β Pic b using both the planet astrometry and an up-to-date compilation of RV measurements (Borgniet et al., in prep) of the system gathered since 2003 with the high-precision spectrometer HARPS. In contrast to the upper limits on the mass derived in Lagrange et al. (2012), these dynamical mass estimates do not rely on the hypothesis of a circular orbit any more. To do this, we modified our existing MCMC code (Chauvin et al. 2012) to account for both the astrometric and RV data sets in the χ2 computation. This introduces two additional parameters in the MCMC simulations: the amplitude K of the RV curve, and an offset velocity. The mass of the planet can be derived from the K value and from the other determined orbital parameters for any orbital solution. Because of the large uncertainty on the RV data, the orbit is still mainly constrained by the astrometric data. Conversely, the mass is constrained by the RV data. We assumed a stellar mass of 1.75 ± 0.05 M⊙. The error on the stellar mass appeared to have only marginal influence on the planet dynamical mass. The posterior distribution of the mass is, however, extremely sensitive to the assumed errors on the RV data and on the prior assumed on the amplitude K (see Appendix A for details). Figure 1 shows two histograms of posterior mass distribution, each of them corresponding to the use of a different prior on K (linear and logarithmic). In both cases, up to 96% of the solutions are below 20 MJup.
4. Physical properties and initial conditions
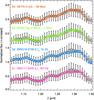 |
Fig. 2 Normalized J-band spectrum of β Pic b (gray squares) compared with best-fitting spectra (see description in Appendix B) of M9.5-L1 objects from samples 1 (pink squares); 2 (blue squares); 3 (green squares); and 4 (red squares). |
The J-band spectrum of β Pic b (Fig. 2) contains all the feature characteristics of late-M and early-L dwarfs: a marked water-band absorption longward of 1.33 μm, a rising pseudo-continuum from 1.1 to 1.33 μm slightly affected from 1.16 to 1.22 μm by FeH absorptions. We compared it to four samples of empirical spectra of MLT dwarfs and young planetary mass objects (Appendix B) using a χ2 (Fig. 2). In sample 1 (composed of objects of various ages) the spectrum of the candidate AB Dor member (age ~ 50−150 Myr; Faherty, priv. comm.) L1 dwarf 2MASSI J0117474-340325 (Burgasser et al. 2008) provides the best fit. Comparisons with the remaining samples confirm that β Pic b is an  dwarf, as previously inferred from the spectral energy distribution (SED) analysis (Bonnefoy et al. 2013; Currie et al. 2013; Males et al. 2014).
We used the bolometric correction of young M9.5-L0 dwarfs (BCK = 3.40 ± 0.02) from Todorov et al. (2010)2 and the mean and dispersion on the Ks-band photometry reported in Males et al. (2014) to find a revised log (L/L⊙) = −3.90 ± 0.07 for β Pic b. We compared the normalized spectrum of β Pic b with predictions from the PHOENIX-based (BT-SETTL10, BT-SETTL13, DRIFT-PHOENIX, described in Witte et al. 2011; Bonnefoy et al. 2013; Manjavacas et al. 2014) and five grids of LESIA atmospheric models (see Appendix C and Baudino et al. 2014) to derive updated Teff and log g estimates (Table 2). A similar analysis derived for the up-to-date SED is reported in Appendix D. The SED and spectra of β Pic b constrain the Teff to 1650 ± 150 K. The fits are less sensitive to log g and to the metallicity. Although log g values higher than 4.7 dex cannot be directly excluded from the spectral fitting, these values and the radii derived from Teff and the luminosity estimates yield masses (see Tables 2 and D.1) greater than the dynamical mass constraints (Sect. 3). The χ2 fit of the J-band spectrum is mostly sensitive to the overal spectral slope and less sensitive to the simultaneous fitting of the water-band absorption longward of 1.3 μm. Therefore, visual inspection yields similar, but different solutions for the DRIFT-PHOENIX (DP) and LESIA models (Fig. 3). The Teff value is consistent with those reported in Bonnefoy et al. (2013), Currie et al. (2013), and Males et al. (2014) using the SED only and/or different atmospheric models. The Teff is also coherent with those derived for young objects at similar spectral types (Bonnefoy et al. 2014; Manjavacas et al. 2014). The dilution factors needed to adjust the model SED expressed in surface fluxes to the apparent fluxes of the planet correspond to a planetary radius of 1.5 ± 0.2RJup (see Bonnefoy et al. 2013). This radius is consistent with those reported in Bonnefoy et al. (2013), Currie et al. (2013), and with the one derived from the Teff and luminosity estimates ( ).
).
Best-fitting atmospheric parameters.
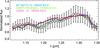 |
Fig. 3 Best-fitting synthetic spectra from the BT-SETTL13, DRIFT-PHOENIX, and LESIA grids found from a visual checking. The parameters Teff/log g/[M/H] are reported for each model. |
The Teff and luminosity of β Pic b match those of “hot-start” evolutionary models (Chabrier et al. 2000; Baraffe et al. 2003) at an age of 21 ± 4 Myr for M = 11.5 ± 0.8MJup and M = 11.2 ± 0.3MJup, respectively. This agrees with the mass constraints of Sect. 3.
To derive quantitative constraints on the initial entropy Si of β Pic b, we used the method of MC14 and performed an MCMC in mass and Si using their evolutionary models up to masses of 17 MJup. The models have gray atmospheres, include deuterium burning (Marleau & Cumming, in prep.), and span in Si the extreme outcomes of any formation process. Figure 4 shows the allowed M and Si combinations that match the luminosity and age taking Gaussian errorbars into account.
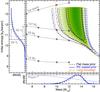 |
Fig. 4 Joint probability contours (68.3, 95, and 99%) on the mass and post-formation entropy of β Pic b from log (L/L⊙) = −3.90 ± 0.07 and an age of 21 ± 4 Myr using a flat prior on Si and a prior flat in mass (dashed black curves) or given by the radial-velocity and astrometry constraints for a linear K prior (solid dark-blue curves). Using the logarithmic-K prior of Fig. 1 gives nearly identical results. The long-dashed orange line shows the combinations matching log (L/L⊙) = −3.90 at 12 Myr, i.e. allowing for an extreme 9 Myr formation delay. The open circles indicate the cold-start post-formation entropies for different final core masses (labeled) or for hot starts (Mordasini 2013, App. B of MC14). The bottom panel displays the mass priors (dotted lines) and the marginalized posterior distributions (black and blue lines), whereas the side panel shows the marginalized Si posterior and the non-flat mass prior’s 90- and 95-% lower limits (up to Si ~ 14). |
5. Discussion
If the system is truly 21 ± 4 Myr old, Fig. 4 shows that β Pic b cannot have formed according to the classic (Marley et al. 2007) parameters of core accretion, which include a supercritical accretion shock (coldest starts) and an initial planetesimal density leading to a 15-M⊕ core. An on average inefficient shock and/or a higher planetesimal density (Mordasini 2013) must be invoked to lead to warmer starts. For a completely efficient accretion shock, the predicted core would need to be ≳65 M⊕. These conclusions are nearly unchanged even assuming an extreme duration for the planet formation phase of 9 Myr (Fig. 4).
Moreover, we find a lower bound3 on the post-formation entropy of Si,min = 10.5 kB baryon-1 at the 95-% level, which is ≈2 kB baryon-1 warmer than the supercritical 15-M⊕ prediction. Finally, for masses within the 68.3-% contour, the MC14 cooling curves predict β Pic b to not be affected by deuterium flashes (Bodenheimer et al. 2013), where the luminosity and Teff of massive objects increase, possibly at very late times (MC14; Marleau & Cumming, in prep.). However, because of differences in boundary conditions and nuclear rate details, and given the high precision of the luminosity measurement, using other cooling tracks can somewhat affect the mass constraints and the
importance of deuterium burning in the cooling history of β Pic b.
Online material
Appendix A: Details on the orbital fit
Appendix A.1: Errors on the radial velocities
The RV of β Pictoris A measured within the same day are extremely variable because of the activity of the star. During the HARPS monitoring of the star, β Pic A was either observed multiple times during a night to evaluate and average the stellar activity, or at a single time (Borgniet et al., in prep.). We averaged the data over one day to estimate a daily RV mean. To estimate the error on the RV corresponding to a night that properly account for the stellar noise, we assumed that the intrinsic RV variability is sinusoidal: A × sin(ω × t + φ) + C(t), with A the amplitude of the variability, ω the angular frequency, t the time, φ the phase, and C an offset velocity. RV measurements performed over one single day can be regarded as successive values of a random variable following this law with random t. The resulting random RV has the following probability function:  (A.1)The variance of this law is A2/ 2. Taking the arithmetic mean of n independent measurements over one night gives an estimate of the offset velocity C with A/
 as error. We now need to estimate A. We assume that C varies with time, but A does not. For a given day with the highest number of measurements N, the statistical variance SN of these data is calculated. An accurate, unbiased estimator of A2 is 2 × (N/ (N − 1)) × SN, so that for any other day with n measurements the error can be estimated to be
  , where s is the mean of the given HARPS RV measurment errors of the day. This way, errors are reduced for a day with many measurements and kept large for days with one or two measurements.
Appendix A.2: Choices of the priors
Priors on the orbital parameters are identical to those used in Chauvin et al. (2012) when only the system astrometry is accounted for in the orbital fit. Changes to them appear to have little influence on the posterior distributions of orbital parameters. In contrast, this is not the case for the mass determination because of the weak constraint provided by the RV data. The most straightforward prior we can assume for the amplitude of the RV curve of β Pic A K is linear, but a logarithmic prior (linear in lnK) is also worth considering because K is proportional to P− 1/3 (where P is the orbital period), and a logarithmic prior for P was already assumed. Figure 1 shows the posterior mass determination for both priors. Because of the activity of the star, the data are compatible with planet masses down to virtually 0. But a lower cutoff at 2 MJup was assumed to remain compatible with the observed luminosity of the planet. The linear prior nevertheless appears to favor larger masses than the logarithmic prior. Then the major difference resides in the shape of the posterior distribution. The linear prior exhibits a clear peak around 6 MJup. This difference illustrates the difficulty in deriving a relevant fit of the mass of β Pic b. Obviously, the RV data are too noisy to allow a clear determination, but i) a conservative upper limit is confirmed; and ii) the peak around 6 MJup needs to be confirmed with future data.
Appendix B: Samples of comparison spectra
For the purpose of the empirical analysis, we used four samples of spectra of ultracool MLT dwarfs found in the literature. The SpecXPrism library4 represents sample 1. Sample 2 is composed of spectra of M and L dwarfs with features indicative of low surface gravity (Allers & Liu 2013; Manjavacas et al. 2014; Liu et al. 2013; Schneider et al. 2014). The third sample is made of spectra of members of 1−150 Myr old young moving groups and clusters (Lodieu et al. 2008; Rice et al. 2010; Bonnefoy et al. 2014; Gagné et al. 2014). The fourth sample is composed of spectra of young MLT companions (Patience et al. 2010; Lafrenière et al. 2010; Wahhaj et al. 2011; Bonnefoy et al. 2010, 2014).
Appendix C: Description of the LESIA model grids
Baudino et al. (2014) developed a radiative-convective equilibrium model for young giant exoplanets in the context of direct imaging. The input parameters are the planet surface gravity (log g), effective temperature (Teff), and elemental composition. Under the additional assumption of thermochemical equilibrium, the model predicts the equilibrium-temperature profile and mixing-ratio profiles of the most important gases. Opacity sources include the H2-He collision-induced absorption and molecular lines from H2O, CO, CH4, NH3, VO, TiO, Na, and K. Line opacity is modeled using k-correlated coefficients pre-calculated over a fixed pressure-temperature grid. Absorption by iron and silicate cloud particles is added above the expected condensation levels with a fixed scale height and a given optical depth at some reference wavelength. To study β Pic b, we built five grids of models with Teff between 700 and 2100 K (100 K increments), log g between 2.1 and 5.5 dex (0.1 dex increments), and solar system abundances (Lodders 2010). One model grid was created without clouds (hereafter set I). We added three grids with cloud particles located between condensation level and a 100 times lower pressure, with a particle radius of 30 μm (τ = 0.1, 1, 3; hereafter set II, III, IV), a scale height equal to the gas scale height, and optical depths (τcloud) of 1τ and 0.15τ at 1.2 μm for Fe and Mg2SiO4, respectively (assuming the same column density for both clouds). We used an additional grid (hereafter set V) with a particle radius of 3 μm and τcloud of 1 and 0.018. The grid properties are summarized in Table C.1.
Properties of the LESIA atmospheric model grids.
Appendix D: Fit of the spectral energy distribution
The planet SED was built from the Ys and CH4S,1% band photometry reported reported in Males et al. (2014), J,H, L′ and M′ band photometry Bonnefoy et al. (2013), Ks-band photometry from Currie et al. (2013), and NB4.04 band magnitude from Quanz et al. (2010). The SED and spectral-fitting procedures are described in Bonnefoy et al. (2013) and Bonnefoy et al. (2014), respectively.
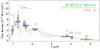 |
Fig. D.1 Comparison of β Pic b SED to best-fitting synthetic spectra (solid line) and fluxes (horizontal lines) from the BT-SETTL, DRIFT-PHOENIX, and LESIA atmospheric models grids. |
The BCK corresponds to the mean of those measured for KPNO-Tau 4 and 2MASS J01415823-4633574, two objects whose J-band spectra reproduce those of β Pic b well.
Acknowledgments
We thank the consortium who built the GPI instrument. We especially wish to thank C. Marois, D. Mouillet, C. Mordasini, J. Faherty, and A. Triaud for fruitfull discussions. We are grateful to J. Gagné, D. Lafrenière, M. Liu, A. Schneider, K. Allers, J. Patience, E. Rice, N. Lodieu, and E. Manjavacas for providing their spectra of young objects. We aknowledge P. Hauschildt and S. Witte for their work on the DRIFT-PHOENIX models. This research has benefitted from the SpeX Prism Spectral Libraries, maintained by A. Burgasser. M.B., G.C., A.M.L., J.R., H.B., F.A., and D.H. acknowledge financial support from the French National Research Agency (ANR) through project grant, ANR10-BLANC0504-01, ANR-07-BLAN-0221, ANR-2010-JCJC-0504-01, and ANR-2010-JCJC-0501-01. ChH and DH highlight EU financial support under FP7 by starting grant. J.L.B. Ph.D is funded by the LabEx Exploration Spatiale des Environnements Planétaires (ESEP) # 2011-LABX-030.
References
- Absil, O., Milli, J., et al. 2013, A&A, 559, L12 [NASA ADS] [CrossRef] [EDP Sciences] [Google Scholar]
- Allers, K. N., & Liu, M. C. 2013, ApJ, 772, 79 [NASA ADS] [CrossRef] [Google Scholar]
- Baraffe, I., Chabrier, G., et al. 2003, A&A, 402, 701 [NASA ADS] [CrossRef] [EDP Sciences] [Google Scholar]
- Baudino, J.-L., Bézard, B., et al. 2014, in IAU Symp., 299 [Google Scholar]
- Binks, A. S., & Jeffries, R. D. 2014, MNRAS, 438, L11 [NASA ADS] [CrossRef] [Google Scholar]
- Boccaletti, A., Lagrange, A.-M., et al. 2013, A&A, 551, L14 [NASA ADS] [CrossRef] [EDP Sciences] [Google Scholar]
- Bodenheimer, P., D’Angelo, G., et al. 2013, ApJ, 770, 120 [NASA ADS] [CrossRef] [Google Scholar]
- Bonnefoy, M., Chauvin, G., et al. 2010, A&A, 512, A52 [NASA ADS] [CrossRef] [EDP Sciences] [Google Scholar]
- Bonnefoy, M., Lagrange, A.-M., et al. 2011, A&A, 528, L15 [NASA ADS] [CrossRef] [EDP Sciences] [Google Scholar]
- Bonnefoy, M., Boccaletti, A., et al. 2013, A&A, 555, A107 [NASA ADS] [CrossRef] [EDP Sciences] [Google Scholar]
- Bonnefoy, M., Chauvin, G., et al. 2014, A&A, 562, A127 [NASA ADS] [CrossRef] [EDP Sciences] [Google Scholar]
- Burgasser, A. J., Liu, M. C., et al. 2008, ApJ, 681, 579 [NASA ADS] [CrossRef] [Google Scholar]
- Chabrier, G., Baraffe, I., & Allard, F. 2000, ApJ, 542, 464 [NASA ADS] [CrossRef] [Google Scholar]
- Chauvin, G., Lagrange, A.-M., et al. 2012, A&A, 542, A41 [NASA ADS] [CrossRef] [EDP Sciences] [Google Scholar]
- Currie, T., Burrows, A., et al. 2013, ApJ, 776, 15 [NASA ADS] [CrossRef] [Google Scholar]
- Gagné, J., Faherty, J. K., et al. 2014, ApJ, 785, L14 [NASA ADS] [CrossRef] [Google Scholar]
- Galicher, R., Rameau, J., et al. 2014, A&A, 565, L4 [NASA ADS] [CrossRef] [EDP Sciences] [Google Scholar]
- Lafrenière, D., Jayawardhana, R., et al. 2010, ApJ, 719, 497 [NASA ADS] [CrossRef] [Google Scholar]
- Lagrange, A.-M., Gratadour, D., et al. 2009, A&A, 493, L21 [NASA ADS] [CrossRef] [EDP Sciences] [Google Scholar]
- Lagrange, A.-M., Bonnefoy, M., et al. 2010, Science, 329, 57 [NASA ADS] [CrossRef] [PubMed] [Google Scholar]
- Lagrange, A.-M., De Bondt, K., et al. 2012, A&A, 542, A18 [NASA ADS] [CrossRef] [EDP Sciences] [Google Scholar]
- Lagrange, A.-M., Meunier, N., et al. 2013, A&A, 559, A83 [NASA ADS] [CrossRef] [EDP Sciences] [Google Scholar]
- Liu, M. C., Magnier, E. A., et al. 2013, ApJ, 777, L20 [NASA ADS] [CrossRef] [Google Scholar]
- Lodders, K. 2010, in Principles and Perspectives in Cosmochemistry, eds. A. Goswami & B. E. Reddy, 379 [Google Scholar]
- Lodieu, N., Hambly, N. C., et al. 2008, MNRAS, 383, 1385 [NASA ADS] [CrossRef] [Google Scholar]
- Macintosh, B., Graham, J. R., et al. 2014, Proc. Natl. Acad. Sci. submitted [arXiv:1403.7520] [Google Scholar]
- Males, J. R., Close, L. M., et al. 2014, ApJ, 786, 32 [NASA ADS] [CrossRef] [Google Scholar]
- Manjavacas, E., Bonnefoy, M., et al. 2014, A&A, 564, A55 [NASA ADS] [CrossRef] [EDP Sciences] [Google Scholar]
- Marleau, G.-D., & Cumming, A. 2014, MNRAS, 437, 1378 [NASA ADS] [CrossRef] [Google Scholar]
- Marley, M. S., Fortney, J. J., et al. 2007, ApJ, 655, 541 [NASA ADS] [CrossRef] [Google Scholar]
- Marois, C., Lafrenière, D., et al. 2006a, ApJ, 647, 612 [NASA ADS] [CrossRef] [Google Scholar]
- Marois, C., Lafrenière, D., et al. 2006b, ApJ, 641, 556 [Google Scholar]
- Marois, C., Correia, C., et al. 2014, in IAU Symp., 299, 48 [Google Scholar]
- Mordasini, C. 2013, A&A, 558, A113 [NASA ADS] [CrossRef] [EDP Sciences] [Google Scholar]
- Patience, J., King, R. R., et al. 2010, A&A, 517, A76 [NASA ADS] [CrossRef] [EDP Sciences] [Google Scholar]
- Pickles, A. J. 1998, PASP, 110, 863 [CrossRef] [Google Scholar]
- Quanz, S. P., Meyer, M. R., et al. 2010, ApJ, 722, L49 [NASA ADS] [CrossRef] [Google Scholar]
- Rice, E. L., Barman, T., et al. 2010, ApJS, 186, 63 [NASA ADS] [CrossRef] [Google Scholar]
- Schneider, A. C., Cushing, M. C., et al. 2014, AJ, 147, 34 [NASA ADS] [CrossRef] [Google Scholar]
- Spiegel, D. S., & Burrows, A. 2012, ApJ, 745, 174 [NASA ADS] [CrossRef] [Google Scholar]
- Todorov, K., Luhman, K. L., & McLeod, K. K. 2010, ApJ, 714, L84 [NASA ADS] [CrossRef] [Google Scholar]
- Wahhaj, Z., Liu, M. C., et al. 2011, ApJ, 729, 139 [NASA ADS] [CrossRef] [Google Scholar]
- Witte, S., Helling, C., et al. 2011, A&A, 529, A44 [NASA ADS] [CrossRef] [EDP Sciences] [Google Scholar]
- Zuckerman, B., Song, I., et al. 2001, ApJ, 562, L87 [NASA ADS] [CrossRef] [Google Scholar]
All Tables
All Figures
|
Fig. 1 Left: MCMC distribution for the semi-major axis of β Pic b, with (black curve) and without (green curve) the new GPI data. Right: dynamical mass distribution of β Pic b inferred from the MCMC fit of the combined planet astrometry and RV measurements of the star. The two priors considered here give two different distributions (see Appendix A). |
| In the text | |
|
Fig. 2 Normalized J-band spectrum of β Pic b (gray squares) compared with best-fitting spectra (see description in Appendix B) of M9.5-L1 objects from samples 1 (pink squares); 2 (blue squares); 3 (green squares); and 4 (red squares). |
| In the text | |
|
Fig. 3 Best-fitting synthetic spectra from the BT-SETTL13, DRIFT-PHOENIX, and LESIA grids found from a visual checking. The parameters Teff/log g/[M/H] are reported for each model. |
| In the text | |
|
Fig. 4 Joint probability contours (68.3, 95, and 99%) on the mass and post-formation entropy of β Pic b from log (L/L⊙) = −3.90 ± 0.07 and an age of 21 ± 4 Myr using a flat prior on Si and a prior flat in mass (dashed black curves) or given by the radial-velocity and astrometry constraints for a linear K prior (solid dark-blue curves). Using the logarithmic-K prior of Fig. 1 gives nearly identical results. The long-dashed orange line shows the combinations matching log (L/L⊙) = −3.90 at 12 Myr, i.e. allowing for an extreme 9 Myr formation delay. The open circles indicate the cold-start post-formation entropies for different final core masses (labeled) or for hot starts (Mordasini 2013, App. B of MC14). The bottom panel displays the mass priors (dotted lines) and the marginalized posterior distributions (black and blue lines), whereas the side panel shows the marginalized Si posterior and the non-flat mass prior’s 90- and 95-% lower limits (up to Si ~ 14). |
| In the text | |
|
Fig. D.1 Comparison of β Pic b SED to best-fitting synthetic spectra (solid line) and fluxes (horizontal lines) from the BT-SETTL, DRIFT-PHOENIX, and LESIA atmospheric models grids. |
| In the text | |
Current usage metrics show cumulative count of Article Views (full-text article views including HTML views, PDF and ePub downloads, according to the available data) and Abstracts Views on Vision4Press platform.
Data correspond to usage on the plateform after 2015. The current usage metrics is available 48-96 hours after online publication and is updated daily on week days.
Initial download of the metrics may take a while.