Fig. 10
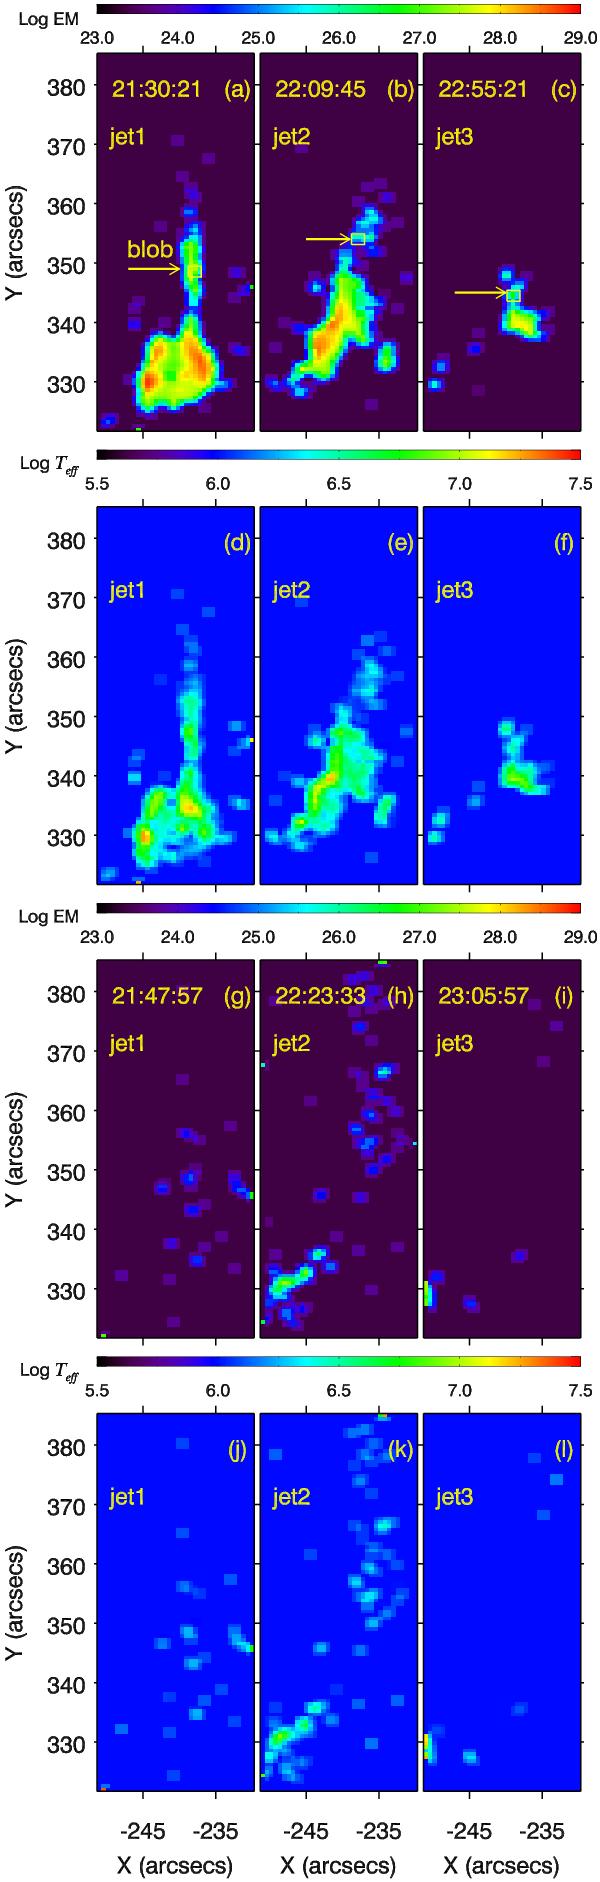
Top two rows: EM a)−c) and temperature maps d)−f) of the jets during their rising phases. The arrows point to the blobs in the jets. The DEM curves of the plasmas in the boxes of a)−c) are displayed in Fig. 11. Bottom two rows: EM g)−i) and temperature maps j)−l) of the jets during their falling phases. Note that EM and Teff are in log -scales.
Current usage metrics show cumulative count of Article Views (full-text article views including HTML views, PDF and ePub downloads, according to the available data) and Abstracts Views on Vision4Press platform.
Data correspond to usage on the plateform after 2015. The current usage metrics is available 48-96 hours after online publication and is updated daily on week days.
Initial download of the metrics may take a while.