Fig. 8
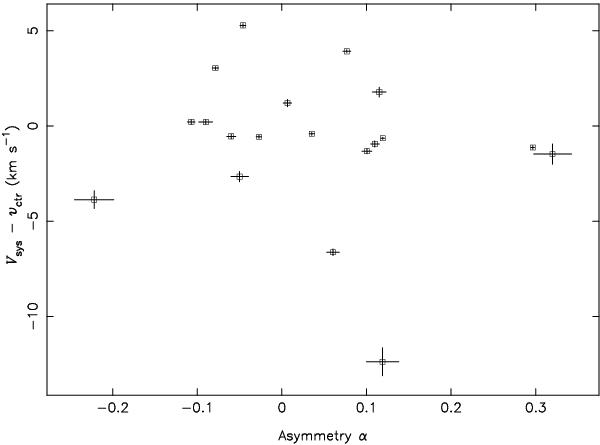
Scatter plot comparing the asymmetry parameter α of the fitted profile model to differences between the present fitted centre velocity vctr and the systemic velocities Vsys obtained by de Blok et al. (2008). The velocity difference is the same as that histogrammed in the upper panel of Fig. 7. Only the 19-member subset of THINGS galaxies examined by de Blok et al. is shown.
Current usage metrics show cumulative count of Article Views (full-text article views including HTML views, PDF and ePub downloads, according to the available data) and Abstracts Views on Vision4Press platform.
Data correspond to usage on the plateform after 2015. The current usage metrics is available 48-96 hours after online publication and is updated daily on week days.
Initial download of the metrics may take a while.