Fig. 3
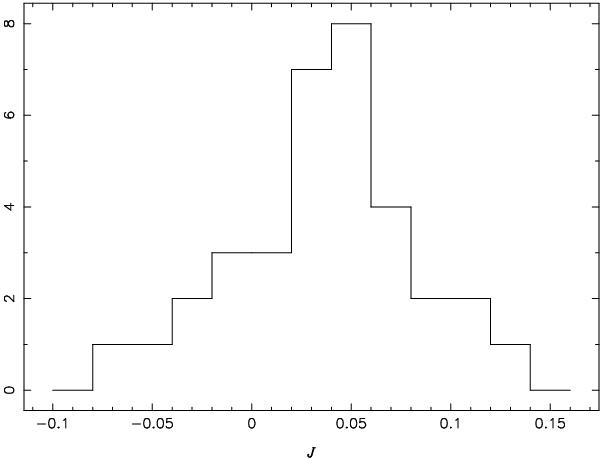
A histogram showing the distribution of “wiggle fraction” J among the THINGS galaxies, as specified by Eq. (8). This quantity indicates the approximate extent of local fluctuations of H i density away from the fitted model. Values shown here as less than zero are technically imaginary (see the respective values in Col. 8 of Table 1), since they are square roots of differences in quadrature which turned out to be negative. Such values simply indicate that fluctuations away from the model fit are, for that galaxy, dominated by measurement noise.
Current usage metrics show cumulative count of Article Views (full-text article views including HTML views, PDF and ePub downloads, according to the available data) and Abstracts Views on Vision4Press platform.
Data correspond to usage on the plateform after 2015. The current usage metrics is available 48-96 hours after online publication and is updated daily on week days.
Initial download of the metrics may take a while.