Fig. 16
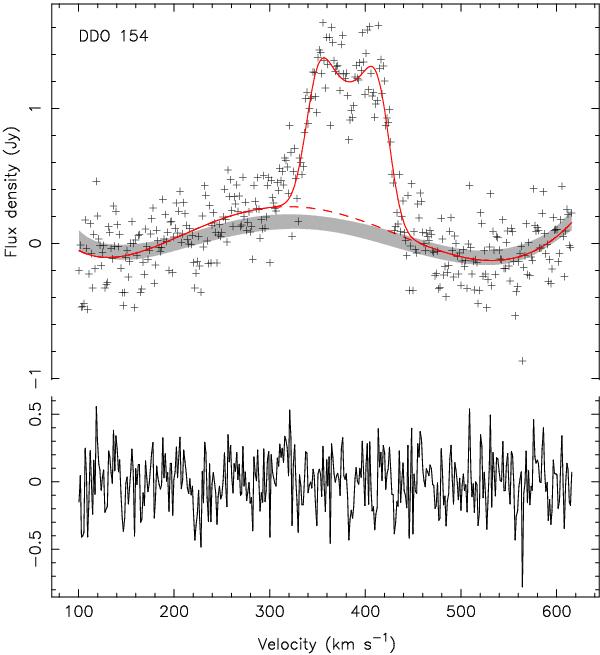
Constructed from the EBHIS cube for DDO 154. The upper plot shows a spectrum from a section of the cube, integrated over the same spatial dimensions as shown in Figs. 17 to 19. The lower plot shows the residuals after subtraction of the fitted model. The red line shows the MCMC-mean profile model, with 6 orders of Chebyshev function. The solid line shows the whole profile, whereas the dashed line just shows the baseline. The ± 1 sigma range of the baseline prior is indicated by the grey band.
Current usage metrics show cumulative count of Article Views (full-text article views including HTML views, PDF and ePub downloads, according to the available data) and Abstracts Views on Vision4Press platform.
Data correspond to usage on the plateform after 2015. The current usage metrics is available 48-96 hours after online publication and is updated daily on week days.
Initial download of the metrics may take a while.