Fig. 13
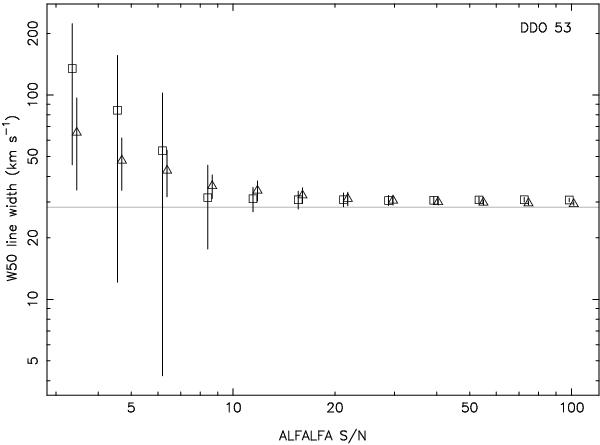
For the same range of S/N values as in Figs. 10 to 12, line width at the 50% height for the raw spectrum versus the same for the fitted profile is compared. DDO 53 is shown here. The square symbol indicates the mean value for the raw spectra, the triangle the mean for the fitted profiles. These respective points have been slightly offset horizontally for clarity. The halftone line indicates the value for the profile fitted to the original THINGS data.
Current usage metrics show cumulative count of Article Views (full-text article views including HTML views, PDF and ePub downloads, according to the available data) and Abstracts Views on Vision4Press platform.
Data correspond to usage on the plateform after 2015. The current usage metrics is available 48-96 hours after online publication and is updated daily on week days.
Initial download of the metrics may take a while.