Fig. 10
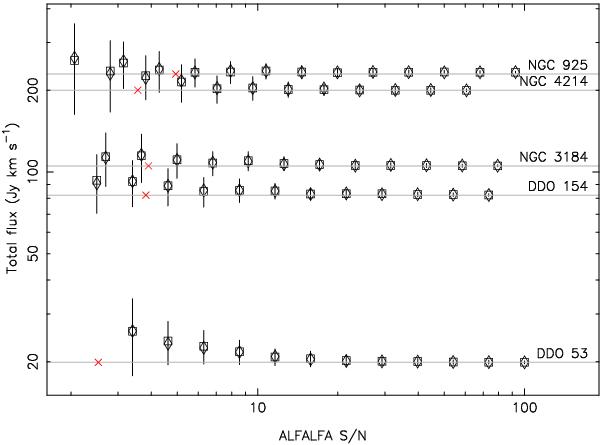
Mean total flux of an ensemble of fitted line profiles over a range of values of ALFALFA S/N. Only 5 of the THINGS galaxies are shown, as labelled. Construction of these Monte Carlo simulations is described in Sect. 3.2.2. The square symbols give the mean, the diamonds the median, and the vertical bars show the standard deviation for each ensemble. The half-tone lines give the values from the profile fits to the original THINGS data. Red X show the points at which the peak-to-rms S/N equals 2.
Current usage metrics show cumulative count of Article Views (full-text article views including HTML views, PDF and ePub downloads, according to the available data) and Abstracts Views on Vision4Press platform.
Data correspond to usage on the plateform after 2015. The current usage metrics is available 48-96 hours after online publication and is updated daily on week days.
Initial download of the metrics may take a while.