Fig. 1
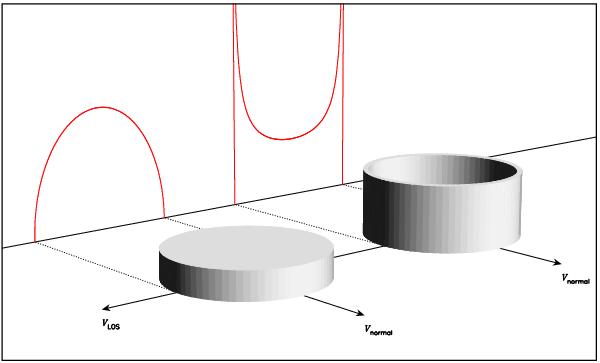
A schematic showing the model distribution of H i in phase space for an edge-on galaxy. The disk and the ring represent respectively the inner and outer components of the model. The height of each body represents the density of H i as a function of velocity. vLOS is the velocity in the line of sight and vnormal is the velocity normal to that, but in the plane of the galaxy. The figures in red represent the H i densities due to the two components, as projected onto the line of sight. Since the densities are displayed as functions of velocity, these red projections in fact give directly the spectral line shapes of the two components. Notes: (i) the ring formally speaking ought to be infinitely thin, but some visible width has been given to it for the sake of easier interpretation; (ii) no attempt has been made to make the height scales of the projection graphs consistent with those of the density figures.
Current usage metrics show cumulative count of Article Views (full-text article views including HTML views, PDF and ePub downloads, according to the available data) and Abstracts Views on Vision4Press platform.
Data correspond to usage on the plateform after 2015. The current usage metrics is available 48-96 hours after online publication and is updated daily on week days.
Initial download of the metrics may take a while.