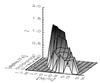
Fig. 15
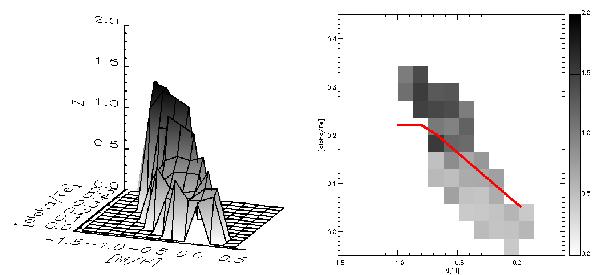
Left panel: 3D plot of the distance to the Galactic plane, in the z-axis, shown as a function of [M/H] and [α/Fe] for the analysed stars (sub-sample e of Fig. 12). Right panel: distribution of the distances to the Galactic plane in [α/Fe] vs. [M/H]. The red line shows the separation between the thick and the thin disc sequences defined in Sect. 4. In this panel, high-Z values are coded in darker grey than lower Z values.
Current usage metrics show cumulative count of Article Views (full-text article views including HTML views, PDF and ePub downloads, according to the available data) and Abstracts Views on Vision4Press platform.
Data correspond to usage on the plateform after 2015. The current usage metrics is available 48-96 hours after online publication and is updated daily on week days.
Initial download of the metrics may take a while.